


1.实验目的
- 了解IP报文格式,熟悉IP报文各个字段含义、长度
- 掌握基于tcpdump和wireshark软件进行数据包抓取和分析技术
2.实验环境
- 硬件要求:阿里云云主机ECS 一台。
- 软件要求:Linux/ Windows 操作系统
3.实验内容
3.1 tcpdump基本用法
tcpdump是一个用于截取网络分组,并输出分组内容的工具。凭借强大的功能和灵活的截取策略,使其成为类UNIX系统下用于网络分析和问题排查的首选工具
tcpdump 支持针对网络层、协议、主机、网络或端口的过滤,并提供and、or、not等逻辑语句来帮助你去掉无用的信息
参考资料:
https://www.cnblogs.com/ggjucheng/archive/2012/01/14/2322659.html
3.2 wireshark基本用法
Wireshark(前称Ethereal)是一个网络封包分析软件。网络封包分析软件的功能是撷取网络封包,并尽可能显示出最为详细的网络封包资料。Wireshark使用WinPCAP作为接口,直接与网卡进行数据报文交换。
网络管理员使用Wireshark来检测网络问题,网络安全工程师使用Wireshark来检查资讯安全相关问题,开发者使用Wireshark来为新的通讯协定除错,普通使用者使用Wireshark来学习网络协定的相关知识。
参考资料:
https://www.wireshark.org/#download
https://pc.qq.com/search.html#!keyword=wireshark
3.3 利用tcpdump抓包,wireshark分析包
在阿里云主机运行命令 traceroute www.xju.edu.cn –T,并利用tcpdump抓包。下载文件到本地机器利用wireshark软件进行分析。
**提示:**1. 必须首先执行抓包命令,然后再执行路径追踪命令。抓包命令 tcpdump -i eth0 -w test.cap
- 可使用
scp命令或者利用xshell和xftp下载数据包到本地机器。
- 利用
tcpdump抓包,通过wireshark分析捕获的数据包,分析IP的报文结构,将IP协议树中各个名字字段,字段长度,字段信息填入下表。
| 字段名 | 字段长度 | 字段值 | 字段表达信息 |
|---|---|---|---|
| Version | 4bit | 4 | 标识采用的 IP 协议的版本号 |
| Header length IP | 4bit | 20 | 标识采用的 IP 协议的版本号 |
| Differentiated services Filed | 8bit | 0x00 | 用来获得更好的服务。这个字段在旧标准中叫做服务类型,用于标识报文的优先级,但实际上一直没有被使用过。 |
| Total length | 16bit | 40 | 标识这个 IP 封包的总容量 |
| Indentification | 16bit | 0x6f33 | 数据包的一个 ID 编号,用于识别标识数据包 |
| flag | 3bit | 0x40 | 确定是否还有更多的分段 |
| Fragment offset | 13bit | 0 | 标识分片报文相对于原始报文起始位置的偏移量 |
| Time to time | 8bit | 64 | 是设置一个“数据报可经过的路由器数量”的上限,也被称为“跳数”。 |
| protocol | 8bit | 6 | 用于标识网络层之上使用了哪种封装协议 |
| Header checksum | 16bit | 0x9d2c | 用于检查报头的正确性,防止 IP 报头数据错乱 |
| source | 32bit | 172.16.2.237 | 源 IP 地址 |
| destination | 32bit | 100.100.27.15 | 目标 IP 地址 |
- 利用
wireshark分析并解读相关traceroute命令执行结果。
**提示:**在wireshark 过滤器工具栏设置仅显示ICMP
4.实验结果与分析
4.1 tcpdump基本用法
tcpdump是一个用于截取网络分组,并输出分组内容的工具。凭借强大的功能和灵活的截取策略,使其成为类UNIX系统下用于网络分析和问题排查的首选工具
tcpdump 支持针对网络层、协议、主机、网络或端口的过滤,并提供and、or、not等逻辑语句来帮助你去掉无用的信息
- 默认启动
tcpdump//普通情况下,直接启动tcpdump将监视第一个网络接口上所有流过的数据包。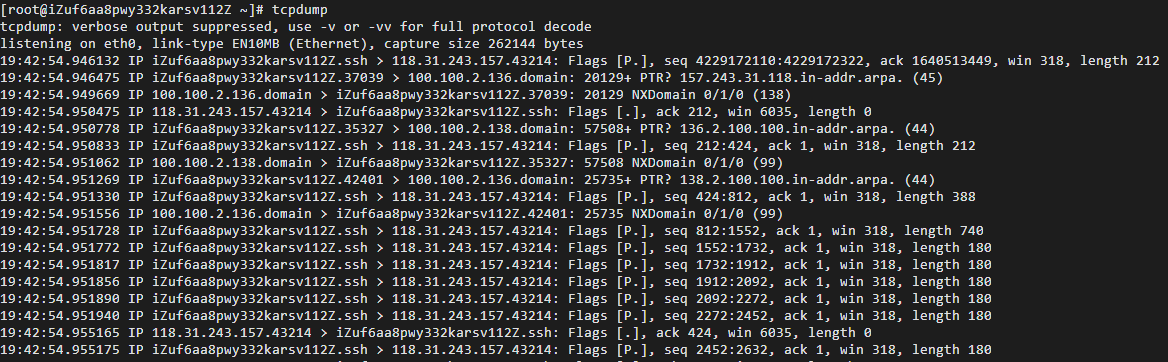
- 监视指定网络接口的数据包
tcpdump -i eth1//如果不指定网卡,默认tcpdump只会监视第一个网络接口,一般是eth04.2 wireshark基本用法
Wireshark(前称Ethereal)是一个网络封包分析软件。网络封包分析软件的功能是撷取网络封包,并尽可能显示出最为详细的网络封包资料。Wireshark使用WinPCAP作为接口,直接与网卡进行数据报文交换。
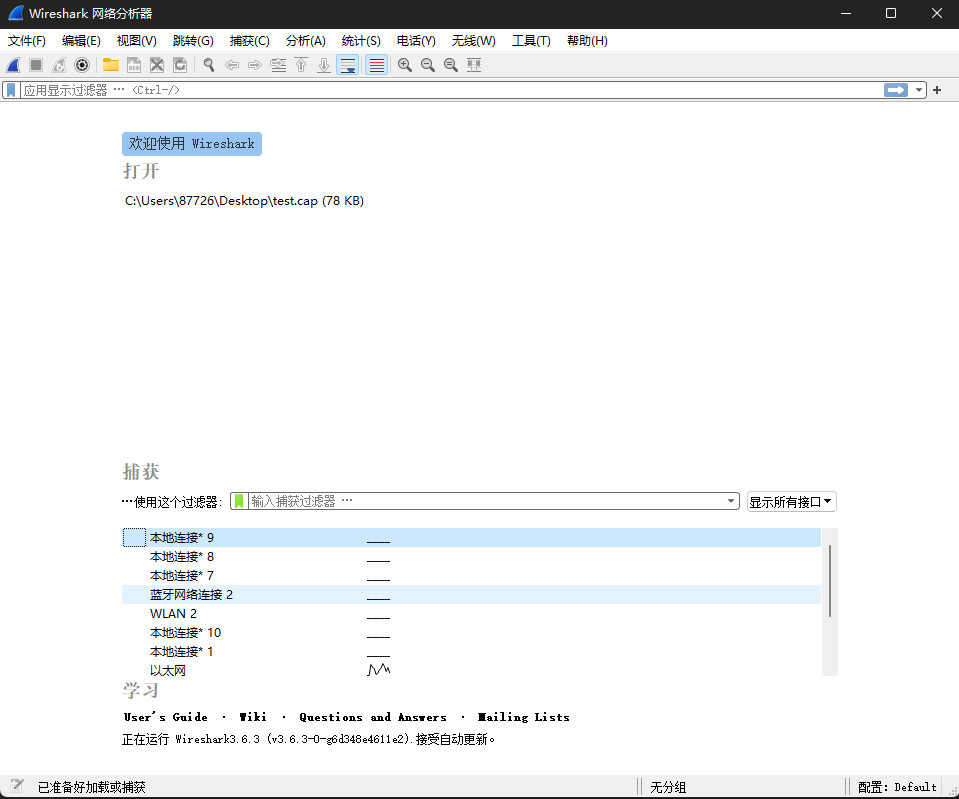
网络管理员使用Wireshark来检测网络问题,网络安全工程师使用Wireshark来检查资讯安全相关问题,开发者使用Wireshark来为新的通讯协定除错,普通使用者使用Wireshark来学习网络协定的相关知识。其界面如图所示。
4.3 利用tcpdump抓包,wireshark分析包
- 执行抓包命令
tcpdump -i eth0 -w test.cap并将获取信息存储于/root/test.cap文件中

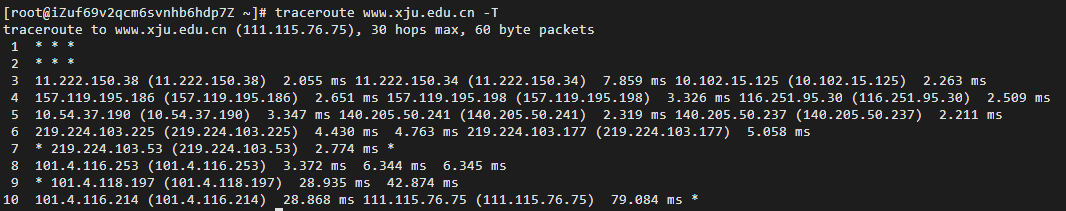
- 运行命令
traceroute www.xju.edu.cn –T
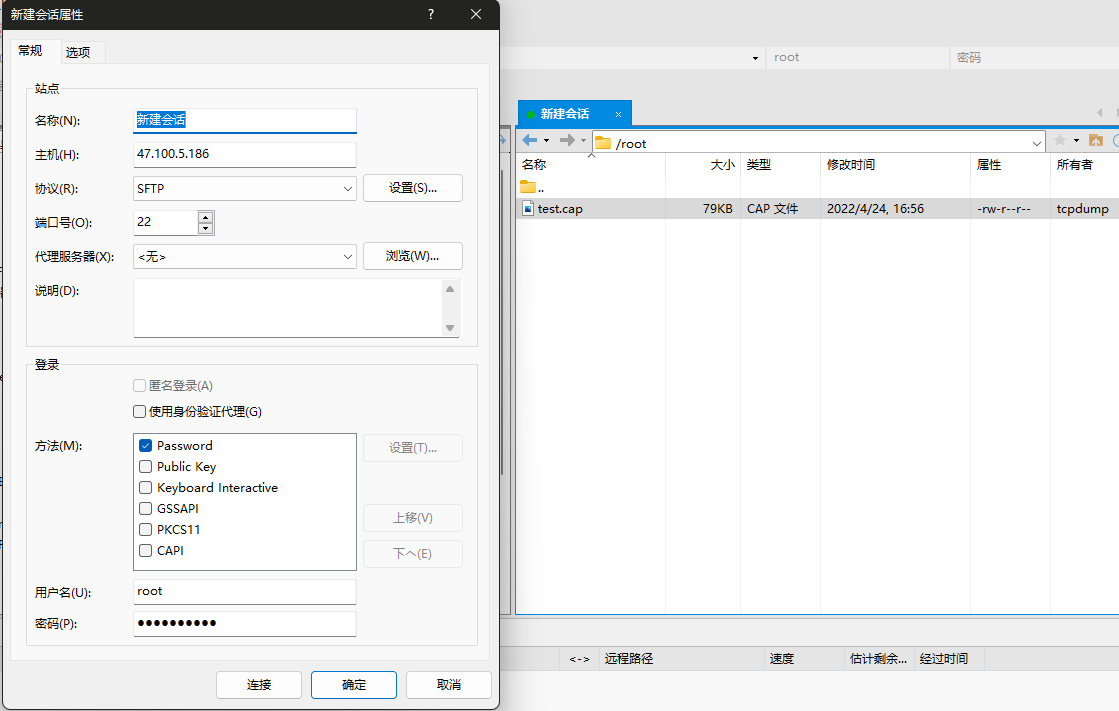
- 使用
xftp连接主机,并将保存的抓包文件保存到电脑
- 使用
wiresharp打开test.cap文件,并分析
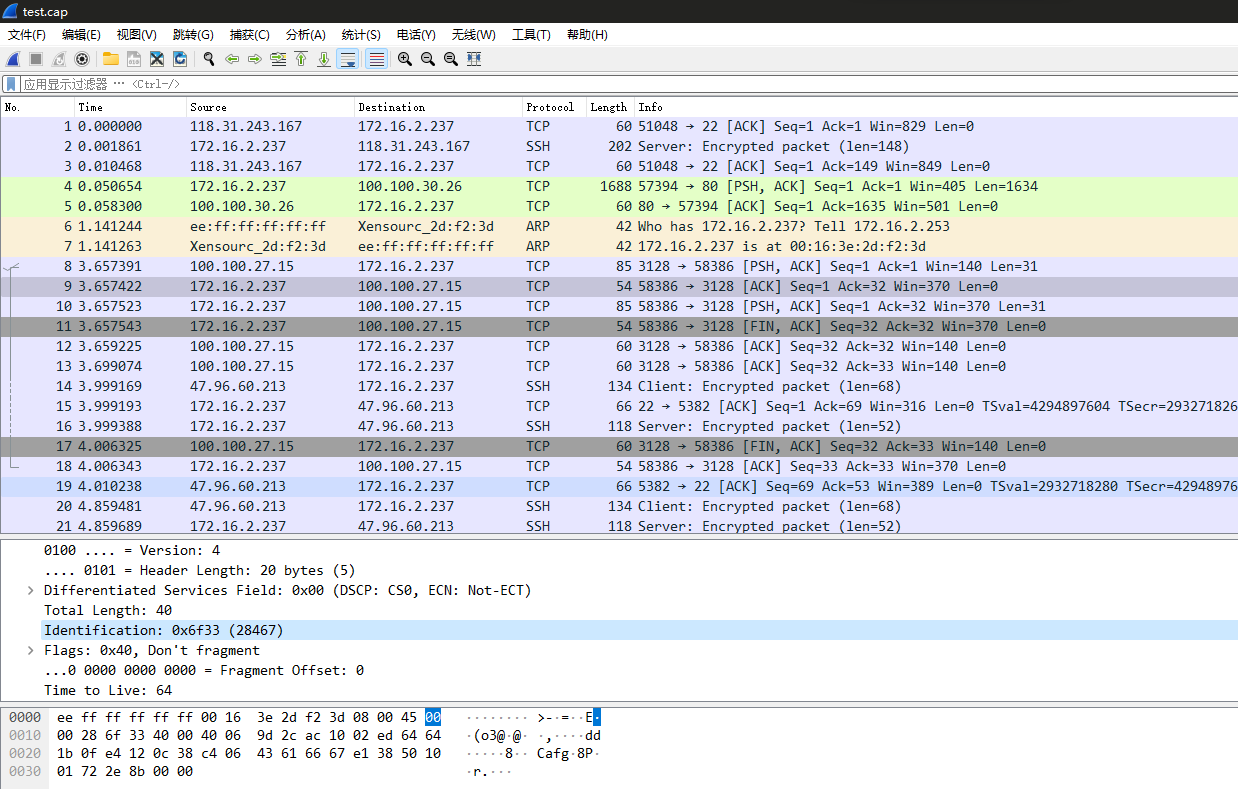
- 对捕获的数据包,分析
IP的报文结构,将IP协议树中各个名字字段,字段长度,字段信息填入下表。
| 字段名 | 字段长度 | 字段值 | 字段表达信息 |
|---|---|---|---|
| Version | 4bit | 4 | 0100 … = Version: 4 |
| Header length IP | 4bit | 20 | … 0101 = Header Length: 20 bytes (5) |
| Differentiated services Filed | 8bit | 0x00 | Differentiated Services Field: 0x00 (DSCP: CS0, ECN: Not-ECT) |
| Total length | 16bit | 40 | Total Length: 40 |
| Indentification | 16bit | 0x6f33 | Identification: 0x6f33 (28467) |
| flag | 3bit | 0x40 | Flags: 0x40, Don’t fragment |
| Fragment offset | 13bit | 0 | …0 0000 0000 0000 = Fragment Offset: 0 |
| Time to time | 8bit | 64 | Time to Live: 64 |
| protocol | 8bit | 6 | Protocol: TCP (6) |
| Header checksum | 16bit | 0x9d2c | Header Checksum: 0x9d2c [validation disabled] |
| source | 32bit | 172.16.2.237 | Source Address: 172.16.2.237 |
| destination | 32bit | 100.100.27.15 | Destination Address: 100.100.27.15 |
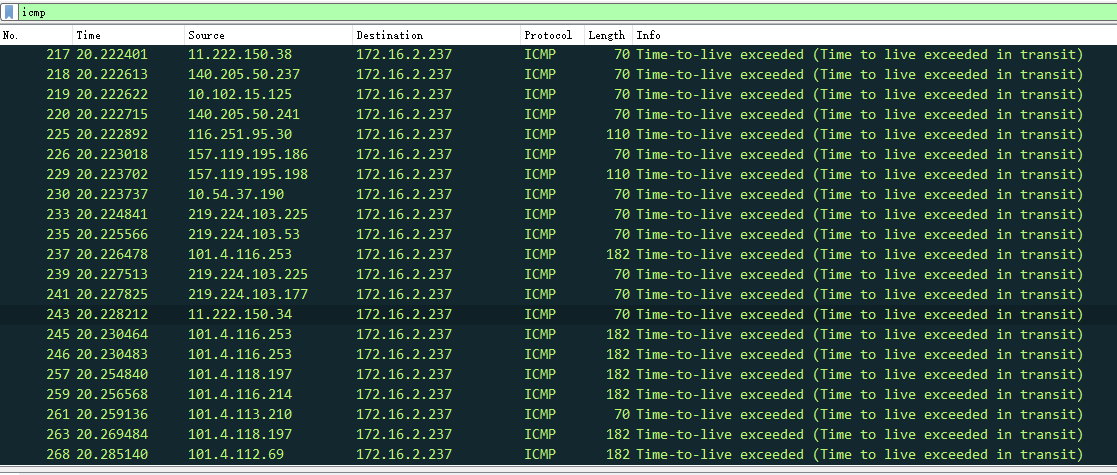
- 分析并解读相关
traceroute命令执行结果,通过ICMP对于执行结果进行分析。
分析结果:
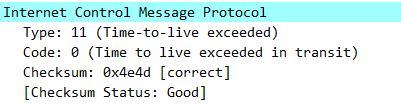
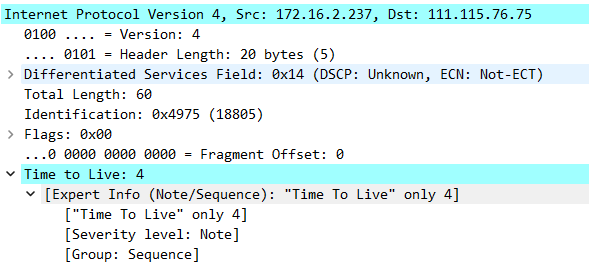
ICMP报文的种类分为两种:ICMP差错报告报文和ICMP询问报文。可以发现,我们捕获的过程中出现的ICMP报文类型都为Time to live exceeded in transit,即为时间超过。随机选择一个ICMP报文,我们可以发现,此条ICMP报文Type=11,Code=0,属于差错报告报文,说明时间超过。其校验和为0x4e4d,结果正确,校验和状态良好,且其TTL为4.
5、实验小结
5.1 问题与解决办法
问题在使用traceroute命令时,出现-bash: traceroute: command not found错误解决方法使用yum install traceroute命令,首先安装traceroute 问题使用Xftp连接服务器时,出现连接错误的情况解决方法使用校园网连接后恢复正常,排查后发现为服务器防火墙原因
5.2 心得体会
- 本次实验报告熟系了对IP协议分析过程中代码及软件的操作,实现对课上知识的印证。通过这次实验,我掌握了traceroute命令使用中的具体流程,了解了常用IP协议分析软件的基本用法,提高了自身编程能力。
- 通过这些常用的IP协议分析命令操作,对IP协议使用时的跟踪分析,让我印证了上课所学的知识。
1. Experiment Objectives
- Understand the IP packet format, and become familiar with the meaning and length of each IP header field
- Master packet capture and analysis techniques based on tcpdump and Wireshark
2. Experimental Environment
- Hardware requirements: One Alibaba Cloud ECS instance.
- Software requirements: Linux/Windows operating system
3. Experimental Content
3.1 Basic tcpdump Usage
tcpdump is a tool used to capture network packets and output their contents. With its powerful features and flexible capture filters, it has become the preferred tool on UNIX-like systems for network analysis and problem troubleshooting.
tcpdump supports filtering by network layer, protocol, host, network, or port, and provides logical statements such as and, or, not to help you weed out unnecessary information.
References:
https://www.cnblogs.com/ggjucheng/archive/2012/01/14/2322659.html
3.2 Basic Wireshark Usage
Wireshark (formerly Ethereal) is a network packet analysis software. The function of network packet analysis software is to capture network packets and display as detailed packet information as possible. Wireshark uses WinPcap as the interface, exchanging data frames directly with the network card.
Network administrators use Wireshark to detect network problems; network security engineers use Wireshark to inspect information security related issues; developers use Wireshark to debug new communication protocols; ordinary users use Wireshark to learn about network protocols. Its interface is shown in the figure below.
References:
https://www.wireshark.org/#download
https://pc.qq.com/search.html#!keyword=wireshark
3.3 Capture Packets with tcpdump and Analyze with Wireshark
On the Alibaba Cloud host, run the command traceroute www.xju.edu.cn –T, and capture packets using tcpdump. Download the file to your local machine and analyze it with Wireshark.
Tips:
- You must run the capture command first, then run the traceroute command. Capture command:
tcpdump -i eth0 -w test.cap - You can download the data using the
scpcommand or by usingxshellandxftp.
- Capture with
tcpdump, analyze the captured data withwireshark, analyze the IP packet structure, and fill the IP protocol tree’s field names, field lengths, and field information into the table below.
| Field Name | Field Length | Field Value | Field Description |
|---|---|---|---|
| Version | 4bit | 4 | Indicates the IP protocol version |
| Header length IP | 4bit | 20 | Indicates the IP header length |
| Differentiated services Field | 8bit | 0x00 | Used to obtain better service. In old standards this field was called Type of Service and used to indicate packet priority, but it has not been used in practice. |
| Total length | 16bit | 40 | Indicates the total length of this IP packet |
| Indentification | 16bit | 0x6f33 | An ID number for the packet used to identify the data packet |
| flag | 3bit | 0x40 | Flags indicating whether there are more fragments |
| Fragment offset | 13bit | 0 | Offset of the fragment relative to the start of the original packet |
| Time to time | 8bit | 64 | Sets the maximum number of routers a datagram can traverse, also known as “hops.” |
| protocol | 8bit | 6 | Identifies which encapsulation protocol is used above the network layer |
| Header checksum | 16bit | 0x9d2c | Used to check the correctness of the header to prevent IP header data corruption |
| source | 32bit | 172.16.2.237 | Source IP address |
| destination | 32bit | 100.100.27.15 | Destination IP address |
- Use Wireshark to analyze and interpret the relevant traceroute command results.
Tip: Set the Wireshark filter bar to display only ICMP
4. Experimental Results and Analysis
4.1 Basic tcpdump Usage
tcpdump is a tool used to capture network packets and output their contents. With its powerful features and flexible capture filters, it has become the preferred tool on UNIX-like systems for network analysis and problem troubleshooting.
tcpdump supports filtering by network layer, protocol, host, network or port, and provides logical statements such as and, or, not to help you weed out useless information
- Default startup
tcpdump//普通情况下,直接启动tcpdump将监视第一个网络接口上所有流过的数据包。
- Capture packets on a specified network interface
tcpdump -i eth1//如果不指定网卡,默认tcpdump只会监视第一个网络接口,一般是eth04.2 Basic Wireshark Usage
Wireshark (formerly Ethereal) is a network packet analysis tool. Its purpose is to capture network packets and display packet details as comprehensively as possible. Wireshark uses WinPcap as an interface to exchange data frames directly with the network card.
Network administrators use Wireshark to diagnose network issues, network security engineers use it to inspect information security problems, developers use it to debug new communication protocols, and ordinary users use it to learn about network protocols. Its interface is shown below.
4.3 Capture Packets with tcpdump and Analyze with Wireshark
- Execute the capture command
tcpdump -i eth0 -w test.capand store the captured information in the file/root/test.cap
- Run the command
traceroute www.xju.edu.cn –T
- Use
xftpto connect to the host, and save the captured packet file to your computer
- Use
wiresharkto open thetest.capfile, and analyze
- For the captured packets, analyze the IP header structure and fill the IP protocol tree with the field names, lengths, and information into the table below.
| Field Name | Field Length | Field Value | Field Description |
|---|---|---|---|
| Version | 4bit | 4 | 0100 … = Version: 4 |
| Header length IP | 4bit | 20 | … 0101 = Header Length: 20 bytes (5) |
| Differentiated services Filed | 8bit | 0x00 | Differentiated Services Field: 0x00 (DSCP: CS0, ECN: Not-ECT) |
| Total length | 16bit | 40 | Total Length: 40 |
| Indentification | 16bit | 0x6f33 | Identification: 0x6f33 (28467) |
| flag | 3bit | 0x40 | Flags: 0x40, Don’t fragment |
| Fragment offset | 13bit | 0 | …0 0000 0000 0000 = Fragment Offset: 0 |
| Time to time | 8bit | 64 | Time to Live: 64 |
| protocol | 8bit | 6 | Protocol: TCP (6) |
| Header checksum | 16bit | 0x9d2c | Header Checksum: 0x9d2c [validation disabled] |
| source | 32bit | 172.16.2.237 | Source Address: 172.16.2.237 |
| destination | 32bit | 100.100.27.15 | Destination Address: 100.100.27.15 |
- Analyze and interpret the results of the related traceroute command execution, using ICMP to analyze the results.
Analysis results:
ICMP message types fall into two categories: ICMP error messages and ICMP echo messages. It can be seen that the ICMP messages we captured are all of type Time Exceeded in Transit, i.e., TTL exceeded. Choosing a random ICMP message, we can see that this ICMP message has Type=11, Code=0, which is an error-message type indicating time exceeded. Its checksum is 0x4e4d, which is correct, and the checksum status is good, with TTL equal to 4.
5. Experiment Summary
5.1 Problems and Solutions
The problem when using the traceroute command produced the error -bash: traceroute: command not found. Solution: use yum install traceroute to install traceroute.
When connecting to the server with Xftp, connection errors occurred. Solution: reconnect via campus network; after investigation found the cause was the server firewall.
5.2 Reflections
- This experiment familiarized me with the operation of code and software involved in IP protocol analysis, validating the knowledge learned in class. Through this experiment, I learned the concrete workflow for using the traceroute command, understood the basic usage of commonly used IP protocol analysis software, and improved my programming abilities.
- Through these common IP protocol analysis command operations, tracing IP protocol usage, this reinforced the knowledge taught in class.
1.実験目的
- IPパケットのフォーマットを理解し、IPパケット各フィールドの意味と長さに慣れる
- tcpdumpとWiresharkソフトウェアを用いたデータパケットのキャプチャと分析技術を習得
2.実験環境
- ハードウェア要件:Alibaba Cloudのクラウドホスト ECS を1台。
- ソフトウェア要件:Linux/Windows オペレーティングシステム
3.実験内容
3.1 tcpdump基本的な使い方
tcpdumpは、ネットワークパケットをキャプチャしてパケット内容を出力するツールです。強力な機能と柔軟なキャプチャ戦略により、UNIX系システム上のネットワーク分析とトラブルシューティングの第一選択ツールとなっています。
tcpdump は、ネットワーク層、プロトコル、ホスト、ネットワークまたはポートに対するフィルタリングをサポートし、and、or、not などの論理文を提供して不要な情報を除去するのに役立ちます。
参考資料:
https://www.cnblogs.com/ggjucheng/archive/2012/01/14/2322659.html
3.2 wireshark基本用法
Wireshark(旧称 Ethereal)は、ネットワークパケット解析ソフトウェアです。ネットワークパケット解析ソフトウェアの機能は、ネットワークパケットを取得し、可能な限り最も詳細なネットワークパケット情報を表示することです。WiresharkはWinPCAPをインタフェースとして使用し、NICとデータグラムを直接交換します。
ネットワーク管理者はネットワークの問題を検出するためにWiresharkを使用し、ネットワークセキュリティエンジニアは情報セキュリティ関連の問題を確認するためにWiresharkを使用し、開発者は新しい通信プロトコルのデバッグのためにWiresharkを使用し、一般のユーザーはネットワークプロトコルに関する知識を学ぶためにWiresharkを使用します。そのインターフェースは図のとおりです。
参考资料:
https://www.wireshark.org/#download
https://pc.qq.com/search.html#!keyword=wireshark
3.3 利用tcpdump抓包,wireshark分析包
在阿里云主機運行命令 traceroute www.xju.edu.cn –T,並利用tcpdump抓包。下載文件到本地機器利用wireshark軟件进行分析。
**提示:**1. 必须首先执行抓包命令,然后再执行路径追踪命令。抓包命令 tcpdump -i eth0 -w test.cap
- 可使用
scp命令或者利用xshell和xftp下载数据包到本地机器。
- tcpdumpを用いてパケットをキャプチャし、Wiresharkでキャプチャデータを分析します。IPヘッダの構造を分析し、IPプロトコルツリーの各名称フィールド、フィールド長、フィールド情報を以下の表に記入します。
| フィールド名 | フィールド長 | フィールド値 | フィールド表現情報 |
|---|---|---|---|
| バージョン (Version) | 4bit | 4 | 0100 … = バージョン: 4 |
| ヘッダ長 IP | 4bit | 20 | … 0101 = ヘッダ長: 20 bytes (5) |
| Differentiated services フィールド | 8bit | 0x00 | Differentiated Services Field: 0x00 (DSCP: CS0, ECN: Not-ECT) |
| 全長 | 16bit | 40 | 全長: 40 |
| 識別子 | 16bit | 0x6f33 | 識別子: 0x6f33 (28467) |
| フラグ | 3bit | 0x40 | Flags: 0x40, Don’t fragment |
| 分割オフセット | 13bit | 0 | …0 0000 0000 0000 = 分割オフセット: 0 |
| 生存時間(TTL) | 8bit | 64 | 生存時間: 64 |
| プロトコル | 8bit | 6 | プロトコル: TCP (6) |
| ヘッダーチェックサム | 16bit | 0x9d2c | ヘッダーチェックサム: 0x9d2c [validation disabled] |
| 送信元アドレス | 32bit | 172.16.2.237 | 送信元アドレス: 172.16.2.237 |
| 宛先アドレス | 32bit | 100.100.27.15 | 宛先アドレス: 100.100.27.15 |
- Wiresharkを用いて関連する traceroute コマンドの実行結果を分析・解釈します。
**提示:**Wireshark のフィルタ欄で表示を ICMP のみに設定します。
4.実験結果と分析
4.1 tcpdump基本的な使い方
tcpdumpは、ネットワークパケットをキャプチャしてパケット内容を出力するツールです。強力な機能と柔軟なキャプチャ戦略により、UNIX系システム上のネットワーク分析とトラブルシューティングの第一選択ツールとなっています。
tcpdump は、ネットワーク層、プロトコル、ホスト、ネットワークまたはポートに対するフィルタリングをサポートし、and、or、not などの論理文を提供して不要な情報を除去するのに役立ちます。
- デフォルトの起動
tcpdump//普通情况下,直接启动tcpdump将监视第一个网络接口上所有流过的数据包。
- 指定ネットワークインターフェースのデータパケットを監視
tcpdump -i eth1//如果不指定网卡,默认tcpdump只会监视第一个网络接口,一般是eth04.2 wireshark基本用法
Wireshark(旧称 Ethereal)は、ネットワークパケット解析ソフトウェアです。ネットワークパケット解析ソフトウェアの機能は、ネットワークパケットを取得し、可能な限り最も詳細なネットワークパケット情報を表示することです。WiresharkはWinPCAPをインタフェースとして使用し、 NICとデータグラムを直接交換します。
ネットワーク管理者はネットワークの問題を検出するためにWiresharkを使用し、ネットワークセキュリティエンジニアは情報セキュリティ関連の問題を確認するためにWiresharkを使用し、開発者は新しい通信プロトコルのデバッグのためにWiresharkを使用し、普通の利用者はネットワークプロトコルの関連知識を学ぶためにWiresharkを使用します。そのインターフェースは図のとおりです。
4.3 利用tcpdumpでのキャプチャ、wiresharkでのパケット分析
- パケットキャプチャコマンド
tcpdump -i eth0 -w test.capを実行し、取得情報を/root/test.capファイルに保存します
- コマンド
traceroute www.xju.edu.cn –Tを実行
xftpでホストに接続し、保存したキャプチャファイルをPCへ保存します
wiresharkでtest.capファイルを開き、分析します
- 捕捉したデータパケットについて、
IPヘッダの構造を分析し、IPプロトコルツリーの各名称フィールド、フィールド長、フィールド情報を以下の表に記入します。
| フィールド名 | フィールド長 | フィールド値 | フィールド表現情報 |
|---|---|---|---|
| バージョン (Version) | 4bit | 4 | 0100 … = バージョン: 4 |
| ヘッダ長 IP | 4bit | 20 | … 0101 = ヘッダ長: 20 bytes (5) |
| Differentiated services フィールド | 8bit | 0x00 | Differentiated Services Field: 0x00 (DSCP: CS0, ECN: Not-ECT) |
| 全長 | 16bit | 40 | 全長: 40 |
| 識別子 | 16bit | 0x6f33 | 識別子: 0x6f33 (28467) |
| フラグ | 3bit | 0x40 | Flags: 0x40, Don’t fragment |
| 分割オフセット | 13bit | 0 | …0 0000 0000 0000 = 分割オフセット: 0 |
| 生存時間(TTL) | 8bit | 64 | 生存時間: 64 |
| プロトコル | 8bit | 6 | プロトコル: TCP (6) |
| ヘッダーチェックサム | 16bit | 0x9d2c | ヘッダーチェックサム: 0x9d2c [validation disabled] |
| 送信元アドレス | 32bit | 172.16.2.237 | 送信元アドレス: 172.16.2.237 |
| 宛先アドレス | 32bit | 100.100.27.15 | 宛先アドレス: 100.100.27.15 |
- 関連する
tracerouteコマンドの結果を分析・解釈します。ICMPを用いて実行結果を分析します。
分析結果:
ICMPパケットの種類は2つに分かれます:ICMPエラーメッセージとICMPエコー(クエリ)メッセージです。キャプチャ中に現れたICMPパケットのタイプはすべて「Time to live exceeded in transit」(TTL超過)で、時間超過を意味します。ランダムに1つのICMPパケットを選ぶと、このパケットのType=11, Code=0で、エラーレポートに該当し、時間超過を示します。そのチェックサムは0x4e4dで、正しく、チェックサムの状態は良好で、TTLは4です。
5.実験のまとめ
5.1 問題と対処方法
tracerouteコマンドを使用した際に -bash: traceroute: command not found エラーが発生した場合の解決方法は、yum install traceroute コマンドを使用して traceroute を最初にインストールします。 Xftpでサーバへ接続する際に接続エラーが発生した場合の対処方法は、キャンパスネットワークで接続した後復旧、原因を調査したところサーバのファイアウォールが原因であると判明しました。
5.2 感想
- 本実験レポートは、IPプロトコル分析の過程でコードとソフトウェアの操作に習熟し、授業で学んだ知識を検証しました。今回の実験を通じて、traceroute コマンドの具体的な使用手順を身につけ、一般的な IP プロトコル分析ソフトの基本的な使い方を理解し、自身のプログラミング能力を向上させました。
- これらの一般的な IP プロトコル分析コマンドの操作を通じ、IP プロトコルの追跡分析を実施することで、授業で学んだ知識を裏付けることができました。
部分信息可能已经过时