


pandas
pandas介绍
Pandas 是一个开源的数据分析和数据处理库,它是基于 Python 编程语言的。
Pandas 提供了易于使用的数据结构和数据分析工具,特别适用于处理结构化数据,如表格型数据(类似于Excel表格)。
Pandas 是数据科学和分析领域中常用的工具之一,它使得用户能够轻松地从各种数据源中导入数据,并对数据进行高效的操作和分析。
Pandas 主要引入了两种新的数据结构:DataFrame 和 Series
- Series: 类似于一维数组或列表,是由一组数据以及与之相关的数据标签(索引)构成。Series 可以看作是 DataFrame 中的一列,也可以是单独存在的一维数据结构。
- DataFrame: 类似于一个二维表格,它是 Pandas 中最重要的数据结构。DataFrame 可以看作是由多个 Series 按列排列构成的表格,它既有行索引也有列索引,因此可以方便地进行行列选择、过滤、合并等操作。
Pandas 提供了丰富的功能,包括:
- 数据清洗:处理缺失数据、重复数据等。
- 数据转换:改变数据的形状、结构或格式。
- 数据分析:进行统计分析、聚合、分组等。
- 数据可视化:通过整合 Matplotlib 和 Seaborn 等库,可以进行数据可视化。
pandas安装
-
安装python
官网下载/docker安装
-
安装pandas
pip install pandas验证使用:
import pandas as pdpd.__version__
pandas series
结构
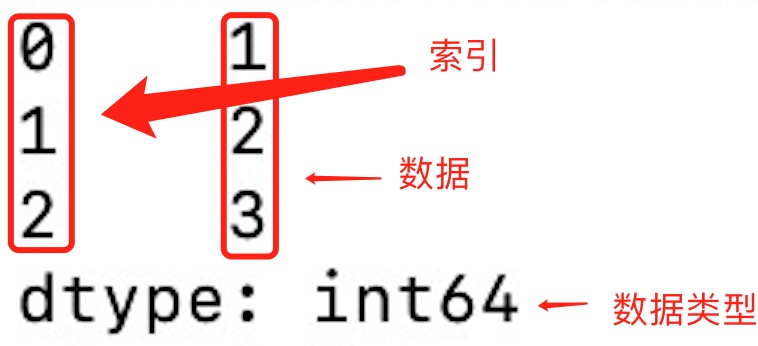
- 索引: 每个 Series 都有一个索引,它可以是整数、字符串、日期等类型。如果没有显式指定索引,Pandas 会自动创建一个默认的整数索引。
- 数据类型: Series 可以容纳不同数据类型的元素,包括整数、浮点数、字符串等。
pandas.Series( data, index, dtype, name, copy)
## data:一组数据(ndarray 类型)。## index:数据索引标签,如果不指定,默认从 0 开始。## dtype:数据类型,默认会自己判断。## name:设置名称。## copy:拷贝数据,默认为 False。实例
-
使用series
import pandas as pda = [1, 2, 3]myvar = pd.Series(a)print(myvar)print(myvar[1])输出为:
-
使用pd.Series设置索引
import pandas as pda = ["Google", "Runoob", "Wiki"]myvar = pd.Series(a, index = ["x", "y", "z"])print(myvar)print(myvar["y"]) -
通过字典来创建
import pandas as pdsites = {1: "Google", 2: "Runoob", 3: "Wiki"}myvar = pd.Series(sites)print(myvar)myvar = pd.Series(sites, index = [1, 2], name="RUNOOB-Series-TEST" )print(myvar)myvar = pd.Series(sites, index = [1, 2], name="RUNOOB-Series-TEST" )print(myvar)
基本操作
-
基本操作
## 获取值value = series[2] ## 获取索引为2的值## 获取多个值subset = series[1:4] ## 获取索引为1到3的值## 使用自定义索引value = series_with_index['b'] ## 获取索引为'b'的值## 索引和值的对应关系for index, value in series_with_index.items():print(f"Index: {index}, Value: {value}") -
基本运算
## 算术运算result = series * 2 ## 所有元素乘以2## 过滤filtered_series = series[series > 2] ## 选择大于2的元素## 数学函数import numpy as npresult = np.sqrt(series) ## 对每个元素取平方根 -
属性和方法
## 获取索引index = series_with_index.index## 获取值数组values = series_with_index.values## 获取描述统计信息stats = series_with_index.describe()## 获取最大值和最小值的索引max_index = series_with_index.idxmax()min_index = series_with_index.idxmin() -
注意事项
- Series 中的数据是有序的。
- 可以将 Series 视为带有索引的一维数组。
- 索引可以是唯一的,但不是必须的。
- 数据可以是标量、列表、NumPy 数组等。
pandas dataframe
dataframe结构
- 列和行: DataFrame 由多个列组成,每一列都有一个名称,可以看作是一个 Series。同时,DataFrame 有一个行索引,用于标识每一行。
- 二维结构: DataFrame 是一个二维表格,具有行和列。可以将其视为多个 Series 对象组成的字典。
- 列的数据类型: 不同的列可以包含不同的数据类型,例如整数、浮点数、字符串等。
pandas.DataFrame( data, index, columns, dtype, copy)
# data:一组数据(ndarray、series, map, lists, dict 类型)。# index:索引值,或者可以称为行标签# columns:列标签,默认为 RangeIndex (0, 1, 2, …, n)# dtype:数据类型,默认会自己判断。# copy:拷贝数据,默认为 False。dataframe实例
-
使用dataframe
import pandas as pddata = [['Google',10],['Runoob',12],['Wiki',13]]df = pd.DataFrame(data,columns=['Site','Age'])print(df) -
使用ndarrays创建
import pandas as pddata = {'Site':['Google', 'Runoob', 'Wiki'], 'Age':[10, 12, 13]}df = pd.DataFrame(data)print (df) -
通过字典来创建
import pandas as pddata = [{'a': 1, 'b': 2},{'a': 5, 'b': 10, 'c': 20}]df = pd.DataFrame(data)print (df)没有对应的部分数据为 NaN。
-
通过loc返回指定行 Pandas 可以使用 loc 属性返回指定行的数据,如果没有设置索引,第一行索引为 0,第二行索引为 1,以此类推
import pandas as pddata = {"calories": [420, 380, 390],"duration": [50, 40, 45]}# 数据载入到 DataFrame 对象df = pd.DataFrame(data)# 返回第一行print(df.loc[0])# 返回第二行print(df.loc[1])# 返回第一行和第二行print(df.loc[[0, 1]])# 指定索引print(df.loc["duration"]) -
pd.DataFrame指定索引
import pandas as pddata = {"calories": [420, 380, 390],"duration": [50, 40, 45]}df = pd.DataFrame(data, index = ["day1", "day2", "day3"])print(df)
dataframe基本操作
-
基本操作
# 获取列name_column = df['Name']# 获取行first_row = df.loc[0]# 选择多列subset = df[['Name', 'Age']]# 过滤行filtered_rows = df[df['Age'] > 30] -
数据操作
# 添加新列df['Salary'] = [50000, 60000, 70000]# 删除列df.drop('City', axis=1, inplace=True)# 排序df.sort_values(by='Age', ascending=False, inplace=True)# 重命名列df.rename(columns={'Name': 'Full Name'}, inplace=True) -
属性和方法
# 获取列名columns = df.columns# 获取形状(行数和列数)shape = df.shape# 获取索引index = df.index# 获取描述统计信息stats = df.describe() -
外部数据源创建
# 从CSV文件创建 DataFramedf_csv = pd.read_csv('example.csv')# 从Excel文件创建 DataFramedf_excel = pd.read_excel('example.xlsx')# 从字典列表创建 DataFramedata_list = [{'Name': 'Alice', 'Age': 25}, {'Name': 'Bob', 'Age': 30}]df_from_list = pd.DataFrame(data_list) -
注意事项
- DataFrame 是一种灵活的数据结构,可以容纳不同数据类型的列。
- 列名和行索引可以是字符串、整数等。
- DataFrame 可以通过多种方式进行数据选择、过滤、修改和分析。
- 通过对 DataFrame 的操作,可以进行数据清洗、转换、分析和可视化等工作。
pandas CSV
介绍
CSV(Comma-Separated Values,逗号分隔值,有时也称为字符分隔值,因为分隔字符也可以不是逗号),其文件以纯文本形式存储表格数据(数字和文本)。
CSV 是一种通用的、相对简单的文件格式,被用户、商业和科学广泛应用。
-
处理csv Pandas 可以很方便的处理 CSV 文件
import pandas as pddf = pd.read_csv('site.csv')print(df.to_string()) -
存储csv 可以使用 to_csv() 方法将 DataFrame 存储为 csv 文件
import pandas as pd# 三个字段 name, site, agenme = ["Google", "Runoob", "Taobao", "Wiki"]st = ["www.google.com", "www.runoob.com", "www.taobao.com", "www.wikipedia.org"]ag = [90, 40, 80, 98]# 字典dict = {'name': nme, 'site': st, 'age': ag}df = pd.DataFrame(dict)# 保存 dataframedf.to_csv('site.csv')
数据处理
head()
head(n) 方法用于读取前面的 n 行,如果不填参数 n ,默认返回 5 行。
import pandas as pd
df = pd.read_csv('nba.csv')print(df.head())
print(df.head(10))tail()
tail(n) 方法用于读取尾部的 n 行,如果不填参数 n ,默认返回 5 行,空行各个字段的值返回 NaN。
import pandas as pd
df = pd.read_csv('nba.csv')print(df.tail())
print(df.tail(10))info()
info() 方法返回表格的一些基本信息:
import pandas as pd
df = pd.read_csv('nba.csv')print(df.info())Pandas JSON
JSON(JavaScript Object Notation,JavaScript 对象表示法),是存储和交换文本信息的语法,类似 XML。
JSON 比 XML 更小、更快,更易解析,更多 JSON 内容可以参考 JSON 教程。
Pandas 可以很方便的处理 JSON 数据
普通JSON处理
import pandas as pd
df = pd.read_json('sites.json')print(df.to_string())
URL = '<https://static.runoob.com/download/sites.json>'df = pd.read_json(URL)print(df)JSON 对象与 Python 字典具有相同的格式,所以我们可以直接将 Python 字典转化为 DataFrame 数据
内嵌JSON处理
使用 json_normalize() 方法将内嵌的数据完整的解析出来
import pandas as pdimport json
# 使用 Python JSON 模块载入数据with open('nested_list.json','r') as f: data = json.loads(f.read())
# 展平数据df_nested_list = pd.json_normalize(data, record_path =['students'])print(df_nested_list)更加复杂的数据
import pandas as pdimport json
# 使用 Python JSON 模块载入数据with open('nested_mix.json','r') as f: data = json.loads(f.read())
df = pd.json_normalize( data, record_path =['students'], meta=[ 'class', ['info', 'president'], ['info', 'contacts', 'tel'] ])
print(df)读取内嵌JSON中的一组数据
使用 glom 模块来处理数据套嵌,glom 模块允许我们使用 . 来访问内嵌对象的属性
-
安装glom
pip3 install glom -
使用
import pandas as pdfrom glom import glomdf = pd.read_json('nested_deep.json')data = df['students'].apply(lambda row: glom(row, 'grade.math'))print(data)
数据清洗
清洗空值
如果我们要删除包含空字段的行,可以使用 dropna() 方法,语法格式如下:
DataFrame.dropna(axis=0, how='any', thresh=None, subset=None, inplace=False)
# axis:默认为 0,表示逢空值剔除整行,如果设置参数 axis=1 表示逢空值去掉整列。# how:默认为 'any' 如果一行(或一列)里任何一个数据有出现 NA 就去掉整行,如果设置 how='all' 一行(或列)都是 NA 才去掉这整行。# thresh:设置需要多少非空值的数据才可以保留下来的。# subset:设置想要检查的列。如果是多个列,可以使用列名的 list 作为参数。# inplace:如果设置 True,将计算得到的值直接覆盖之前的值并返回 None,修改的是源数据。可以通过 isnull() 判断各个单元格是否为空。
在pandas.read_csv中可以指定na_values来指定空值
import pandas as pd
df = pd.read_csv('property-data.csv')
print(df['NUM_BEDROOMS'])print(df['NUM_BEDROOMS'].isnull())
# 指定空数据missing_values = ["n/a", "na", "--"]df = pd.read_csv('property-data.csv', na_values = missing_values)
print (df['NUM_BEDROOMS'])print (df['NUM_BEDROOMS'].isnull())
# 删除空数据new_df = df.dropna()print(new_df.to_string())
# 修改原DataFramedf.dropna(inplace = True)print(df.to_string())
# 移除指定有空值的行df.dropna(subset=['ST_NUM'], inplace = True)print(df.to_string())使用fillna()替换空值
替换空单元格的常用方法是计算列的均值、中位数值或众数。
Pandas使用 mean()、median() 和 mode() 方法计算列的均值(所有值加起来的平均值)、中位数值(排序后排在中间的数)和众数(出现频率最高的数)。
import pandas as pd
df = pd.read_csv('property-data.csv')
# 使用 12345 替换空字段df.fillna(12345, inplace = True)print(df.to_string())
# 使用均值替换空字段x = df["ST_NUM"].mean()df["ST_NUM"].fillna(x, inplace = True)print(df.to_string())
# 使用中位数替换空字段x = df["ST_NUM"].median()df["ST_NUM"].fillna(x, inplace = True)print(df.to_string())
# 使用众数替换空字段x = df["ST_NUM"].mode()df["ST_NUM"].fillna(x, inplace = True)print(df.to_string())清洗格式错误
数据格式错误的单元格会使数据分析变得困难,甚至不可能。
我们可以通过包含空单元格的行,或者将列中的所有单元格转换为相同格式的数据。
import pandas as pd
# 第三个日期格式错误data = { "Date": ['2020/12/01', '2020/12/02' , '20201226'], "duration": [50, 40, 45]}df = pd.DataFrame(data, index = ["day1", "day2", "day3"])
# 在新的python3中,下句会报错,需要加上format='mixed'明确格式混合可以正常运行# pd.to_datetime(df['Date'])df['Date'] = pd.to_datetime(df['Date'], format='mixed')print(df.to_string())使用astype修改数据格式
data['语文'].dropna(how='any').astype('int')清洗错误数据
import pandas as pd
person = { "name": ['Google', 'Runoob' , 'Taobao'], "age": [50, 200, 12345]}
df = pd.DataFrame(person)
# 直接修改数据df.loc[2, 'age'] = 30
# 循环判断for x in df.index: if df.loc[x, "age"] > 120: df.loc[x, "age"] = 120
# 删除行for x in df.index: if df.loc[x, "age"] > 120: df.drop(x, inplace = True)
print(df.to_string())清洗重复数据
如果我们要清洗重复数据,可以使用 duplicated() 和 drop_duplicates() 方法。
如果对应的数据是重复的,duplicated() 会返回 True,否则返回 False。
import pandas as pd
person = { "name": ['Google', 'Runoob', 'Runoob', 'Taobao'], "age": [50, 40, 40, 23]}df = pd.DataFrame(person)
# 查找重复数据print(df.duplicated())
# 删除重复数据df.drop_duplicates(inplace = True)print(df)pandas
Pandas Introduction
Pandas is an open-source library for data analysis and data processing, based on the Python programming language.
Pandas provides easy-to-use data structures and data analysis tools, especially suitable for handling structured data such as tabular data (similar to Excel spreadsheets).
Pandas is one of the commonly used tools in data science and analytics, enabling users to easily import data from various data sources and perform efficient operations and analysis on the data.
Pandas introduces two main data structures: DataFrame and Series
- Series: Similar to a one-dimensional array or list, consisting of a set of data and associated data labels (indices). A Series can be viewed as a column in a DataFrame, or as a standalone one-dimensional data structure.
- DataFrame: Similar to a two-dimensional table, it is the most important data structure in Pandas. DataFrame can be seen as a table composed of multiple Series arranged by column; it has both row indices and column indices, making it convenient to perform row/column selection, filtering, merging, etc.
Pandas provides a rich set of features, including:
- Data cleaning: handling missing data, duplicate data, etc.
- Data transformation: changing the shape, structure, or format of data.
- Data analysis: performing statistical analysis, aggregation, grouping, etc.
- Data visualization: by integrating libraries such as Matplotlib and Seaborn, you can perform data visualization.
Pandas Installation
-
Install Python
Download from the official site / Docker installation
-
Install Pandas
pip install pandasValidation:
import pandas as pdpd.__version__
Pandas Series
Structure
- Index: Each Series has an index, which can be integers, strings, dates, etc. If no explicit index is specified, Pandas automatically creates a default integer index.
- Data type: A Series can contain elements of different data types, including integers, floats, strings, etc.
pandas.Series( data, index, dtype, name, copy)
## data:A set of data (ndarray type).## index:Data indexing labels; if not specified, default starts from 0.## dtype:Data type; defaults to auto-detection.## name:Set the name.## copy:Copy the data, defaults to False.Examples
-
Using series
import pandas as pda = [1, 2, 3]myvar = pd.Series(a)print(myvar)print(myvar[1])Output:
-
Setting index with pd.Series
import pandas as pda = ["Google", "Runoob", "Wiki"]myvar = pd.Series(a, index = ["x", "y", "z"])print(myvar)print(myvar["y"]) -
Creating from a dictionary
import pandas as pdsites = {1: "Google", 2: "Runoob", 3: "Wiki"}myvar = pd.Series(sites)print(myvar)myvar = pd.Series(sites, index = [1, 2], name="RUNOOB-Series-TEST" )print(myvar)myvar = pd.Series(sites, index = [1, 2], name="RUNOOB-Series-TEST" )print(myvar)
Basic Operations
-
Basic Operations
## Get valuevalue = series[2] ## Get the value with index 2## Get multiple valuessubset = series[1:4] ## Get the values with index 1 to 3## Use a custom indexvalue = series_with_index['b'] ## Get the value for index 'b'## Index and value correspondencefor index, value in series_with_index.items():print(f"Index: {index}, Value: {value}") -
Arithmetic Operations
## Arithmetic operationsresult = series * 2 ## Multiply all elements by 2## Filteringfiltered_series = series[series > 2] ## Select elements greater than 2## Mathematical functionsimport numpy as npresult = np.sqrt(series) ## Take the square root of each element -
Attributes and Methods
## Get indexindex = series_with_index.index## Get values arrayvalues = series_with_index.values## Get descriptive statisticsstats = series_with_index.describe()## Get the index of the maximum and minimum valuesmax_index = series_with_index.idxmax()min_index = series_with_index.idxmin() -
Notes
- Data in a Series is ordered.
- A Series can be viewed as a one-dimensional array with an index.
- The index can be unique, but it is not required.
- Data can be scalars, lists, NumPy arrays, etc.
Pandas DataFrame
DataFrame Structure
- Columns and rows: DataFrame is composed of multiple columns, each column has a name and can be seen as a Series. At the same time, DataFrame has a row index used to identify each row.
- Two-dimensional structure: DataFrame is a two-dimensional table with rows and columns. It can be viewed as a dictionary of multiple Series objects.
- Data types of columns: Different columns can contain different data types, such as integers, floats, strings, etc.
pandas.DataFrame( data, index, columns, dtype, copy)
# data:A set of data (ndarray, series, map, lists, dict types).# index: The index values, or row labels# columns: Column labels, default is RangeIndex (0, 1, 2, ..., n)# dtype: Data type; defaults to auto-detection.# copy: Copy the data, defaults to False.DataFrame Examples
-
Using DataFrame
import pandas as pddata = [['Google',10],['Runoob',12],['Wiki',13]]df = pd.DataFrame(data,columns=['Site','Age'])print(df) -
Creating from ndarrays
import pandas as pddata = {'Site':['Google', 'Runoob', 'Wiki'], 'Age':[10, 12, 13]}df = pd.DataFrame(data)print (df) -
Creating from dictionaries
import pandas as pddata = [{'a': 1, 'b': 2},{'a': 5, 'b': 10, 'c': 20}]df = pd.DataFrame(data)print (df)Missing parts of data are NaN.
-
Returning specified rows with loc Pandas can use the loc attribute to return data for specified rows. If no index is set, the first row has index 0, the second row 1, and so on
import pandas as pddata = {"calories": [420, 380, 390],"duration": [50, 40, 45]}# Load data into a DataFrame objectdf = pd.DataFrame(data)# Return the first rowprint(df.loc[0])# Return the second rowprint(df.loc[1])# Return the first and second rowsprint(df.loc[[0, 1]])# Specify the indexprint(df.loc["duration"]) -
pd.DataFrame with specified index
import pandas as pddata = {"calories": [420, 380, 390],"duration": [50, 40, 45]}df = pd.DataFrame(data, index = ["day1", "day2", "day3"])print(df)
Basic DataFrame Operations
-
Basic Operations
# Get a columnname_column = df['Name']# Get a rowfirst_row = df.loc[0]# Select multiple columnssubset = df[['Name', 'Age']]# Filter rowsfiltered_rows = df[df['Age'] > 30] -
Data Manipulation
# Add a new columndf['Salary'] = [50000, 60000, 70000]# Delete a columndf.drop('City', axis=1, inplace=True)# Sortdf.sort_values(by='Age', ascending=False, inplace=True)# Rename a columndf.rename(columns={'Name': 'Full Name'}, inplace=True) -
Attributes and Methods
# Get column namescolumns = df.columns# Get shape (rows and columns)shape = df.shape# Get indexindex = df.index# Get descriptive statisticsstats = df.describe() -
Creating from external data sources
# Create DataFrame from a CSV filedf_csv = pd.read_csv('example.csv')# Create DataFrame from an Excel filedf_excel = pd.read_excel('example.xlsx')# Create DataFrame from a list of dictionariesdata_list = [{'Name': 'Alice', 'Age': 25}, {'Name': 'Bob', 'Age': 30}]df_from_list = pd.DataFrame(data_list) -
Notes
- DataFrame is a flexible data structure that can accommodate columns with different data types.
- Column names and row indices can be strings, integers, etc.
- DataFrame can be queried, filtered, modified, and analyzed in many ways.
- Through working with DataFrame, you can perform data cleaning, transformation, analysis, and visualization.
Pandas CSV
Introduction
CSV (Comma-Separated Values; sometimes also referred to as Character-Separated Values, since the separator character can be something other than a comma) stores tabular data (numbers and text) in plain text files.
CSV is a general-purpose, relatively simple file format widely used by users, businesses, and scientists.
-
Handling CSVs Pandas can easily handle CSV files
import pandas as pddf = pd.read_csv('site.csv')print(df.to_string()) -
Storing CSVs You can use the to_csv() method to store a DataFrame as a CSV file
import pandas as pd# Three fields name, site, agenme = ["Google", "Runoob", "Taobao", "Wiki"]st = ["www.google.com", "www.runoob.com", "www.taobao.com", "www.wikipedia.org"]ag = [90, 40, 80, 98]# Dictionarydict = {'name': nme, 'site': st, 'age': ag}df = pd.DataFrame(dict)# Save dataframedf.to_csv('site.csv')
Data Processing
head()
head(n) method is used to read the first n rows; if n is not provided, it defaults to 5 rows.
import pandas as pd
df = pd.read_csv('nba.csv')print(df.head())
print(df.head(10))tail()
tail(n) method is used to read the last n rows; if n is not provided, it defaults to 5 rows, and the values of empty rows are NaN.
import pandas as pd
df = pd.read_csv('nba.csv')print(df.tail())
print(df.tail(10))info()
info() method returns some basic information about the table:
import pandas as pd
df = pd.read_csv('nba.csv')print(df.info())Pandas JSON
JSON (JavaScript Object Notation) is a syntax for storing and exchanging text information, similar to XML.
JSON is smaller, faster, and easier to parse than XML; for more JSON content, refer to JSON tutorials.
Pandas can easily handle JSON data
Plain JSON Handling
import pandas as pd
df = pd.read_json('sites.json')print(df.to_string())
URL = '<https://static.runoob.com/download/sites.json>'df = pd.read_json(URL)print(df)JSON objects have the same format as Python dictionaries, so we can directly convert Python dictionaries into DataFrame data
Nested JSON Handling
Using the json_normalize() method to fully parse nested data
import pandas as pdimport json
# Load data using Python's JSON modulewith open('nested_list.json','r') as f: data = json.loads(f.read())
# Flatten datadf_nested_list = pd.json_normalize(data, record_path =['students'])print(df_nested_list)More complex data
import pandas as pdimport json
# Load data using Python's JSON modulewith open('nested_mix.json','r') as f: data = json.loads(f.read())
df = pd.json_normalize( data, record_path =['students'], meta=[ 'class', ['info', 'president'], ['info', 'contacts', 'tel'] ])
print(df)Reading a Group of Data from Nested JSON
Use the glom module to handle nested data; the glom module allows us to access nested object attributes using dot notation
-
Install glom
pip3 install glom -
Usage
import pandas as pdfrom glom import glomdf = pd.read_json('nested_deep.json')data = df['students'].apply(lambda row: glom(row, 'grade.math'))print(data)
Data Cleaning
Cleaning Missing Values
If we want to delete rows that contain empty fields, we can use the dropna() method; the syntax is as follows:
DataFrame.dropna(axis=0, how='any', thresh=None, subset=None, inplace=False)
# axis: defaults to 0, meaning drop the entire row when a missing value is present; if axis=1 is set, drop the entire column.# how: defaults to 'any'. If any data in a row (or column) has NA, drop the entire row; if how='all', a row (or column) where all values are NA is dropped.# thresh: set how many non-empty values are required to keep the row.# subset: set the columns to check. If multiple columns, you can use a list of column names.# inplace: If True is set, the calculated values overwrite the previous values and return None, modifying the source data.You can use isnull() to determine whether each cell is empty.
In pandas.read_csv you can specify na_values to designate missing values
import pandas as pd
df = pd.read_csv('property-data.csv')
print(df['NUM_BEDROOMS'])print(df['NUM_BEDROOMS'].isnull())
# Specify missing datamissing_values = ["n/a", "na", "--"]df = pd.read_csv('property-data.csv', na_values = missing_values)
print (df['NUM_BEDROOMS'])print (df['NUM_BEDROOMS'].isnull())
# Remove missing datanew_df = df.dropna()print(new_df.to_string())
# Modify the original DataFramedf.dropna(inplace = True)print(df.to_string())
# Remove rows with missing values in specified columnsdf.dropna(subset=['ST_NUM'], inplace = True)print(df.to_string())Using fillna() to replace missing values
A common method to replace empty cells is to compute the mean, median, or mode of the column.
Pandas uses mean(), median(), and mode() to compute the column mean (the average of all values), median (the middle value after sorting), and mode (the value that appears most frequently).
import pandas as pd
df = pd.read_csv('property-data.csv')
# Replace missing fields with 12345df.fillna(12345, inplace = True)print(df.to_string())
# Replace missing fields with the meanx = df["ST_NUM"].mean()df["ST_NUM"].fillna(x, inplace = True)print(df.to_string())
# Replace missing fields with the medianx = df["ST_NUM"].median()df["ST_NUM"].fillna(x, inplace = True)print(df.to_string())
# Replace missing fields with the modex = df["ST_NUM"].mode()df["ST_NUM"].fillna(x, inplace = True)print(df.to_string())Cleaning Incorrect Data
Data with incorrect formats can make data analysis difficult, even impossible.
We can address this by either including rows with empty cells, or converting all cells in a column to the same format data.
import pandas as pd
# The third date format is incorrectdata = { "Date": ['2020/12/01', '2020/12/02' , '20201226'], "duration": [50, 40, 45]}df = pd.DataFrame(data, index = ["day1", "day2", "day3"])
# In newer Python 3, the following will raise an error; you need to specify format='mixed' to clearly indicate mixed formats to run properly# pd.to_datetime(df['Date'])df['Date'] = pd.to_datetime(df['Date'], format='mixed')print(df.to_string())Using astype to modify data types
data['语文'].dropna(how='any').astype('int')Cleaning Erroneous Data
import pandas as pd
person = { "name": ['Google', 'Runoob' , 'Taobao'], "age": [50, 200, 12345]}
df = pd.DataFrame(person)
# Directly modify datadf.loc[2, 'age'] = 30
# Loop-based checksfor x in df.index: if df.loc[x, "age"] > 120: df.loc[x, "age"] = 120
# Delete rowsfor x in df.index: if df.loc[x, "age"] > 120: df.drop(x, inplace = True)
print(df.to_string())Cleaning Duplicate Data
If we want to clean duplicate data, you can use duplicated() and drop_duplicates() methods.
If the data is duplicated, duplicated() will return True; otherwise, it returns False.
import pandas as pd
person = { "name": ['Google', 'Runoob', 'Runoob', 'Taobao'], "age": [50, 40, 40, 23]}df = pd.DataFrame(person)
# Find duplicated dataprint(df.duplicated())
# Remove duplicate datadf.drop_duplicates(inplace = True)print(df)pandas
pandasの紹介
Pandas は、Python プログラミング言語をベースにしたオープンソースのデータ分析・データ処理ライブラリです。
Pandas は、使いやすいデータ構造とデータ分析ツールを提供し、特に表形式データ(Excel の表に似たデータなど)の処理に適しています。
Pandas はデータサイエンスおよび分析分野で広く使われているツールの一つで、さまざまなデータソースからデータを容易に取り込み、データを効率的に操作・分析できるようにします。
Pandas は主に2つの新しいデータ構造を導入しました:DataFrame と Series
- Series: 一次元配列またはリストと似ており、一組のデータとそれに関連するデータラベル(インデックス)で構成されます。Series は DataFrame の列のようにも、単独の1次元データ構造としても扱えます。
- DataFrame: 二次元の表のようなもので、Pandas の中で最も重要なデータ構造です。DataFrame は複数の Series を列方向に並べてできた表で、行インデックスと列インデックスの両方を持つため、行と列の選択、フィルタ、結合などを容易に行えます。
Pandas は豊富な機能を提供します。以下を含みます:
- データクリーニング:欠損データ、重複データなどの処理。
- データ変換:データの形状・構造・形式を変更。
- データ分析:統計分析、集計、グルーピングなど。
- データの可視化:Matplotlib や Seaborn などのライブラリと統合してデータの可視化を行うことができます。
pandasのインストール
-
Pythonのインストール
公式サイトからダウンロード/ Docker でのインストール
-
pandasのインストール
pip install pandas動作確認:
2024-01-02 22:26:35の出力(例)
import pandas as pdpd.__version__pandas series
構造
- インデックス: 各 Series にはインデックスがあり、整数・文字列・日付などの型になり得ます。明示的にインデックスを指定しない場合、Pandasはデフォルトの整数インデックスを自動作成します。
- データ型: Series は異なるデータ型の要素を格納できます。整数、浮動小数点数、文字列など。
pandas.Series( data, index, dtype, name, copy)
## data:一組のデータ(ndarray 型)。## index:データのインデックスラベル。指定しなければ 0 から始まるデフォルト。## dtype:データ型。デフォルトは自動判定。## name:名前を設定。## copy:データをコピー。デフォルトは False。実例
-
Series の使用
import pandas as pda = [1, 2, 3]myvar = pd.Series(a)print(myvar)print(myvar[1])出力は:
-
pd.Series でインデックスを設定
import pandas as pda = ["Google", "Runoob", "Wiki"]myvar = pd.Series(a, index = ["x", "y", "z"])print(myvar)print(myvar["y"]) -
辞書から作成
import pandas as pdsites = {1: "Google", 2: "Runoob", 3: "Wiki"}myvar = pd.Series(sites)print(myvar)myvar = pd.Series(sites, index = [1, 2], name="RUNOOB-Series-TEST" )print(myvar)myvar = pd.Series(sites, index = [1, 2], name="RUNOOB-Series-TEST" )print(myvar)
基本操作
-
基本操作
## 値の取得value = series[2] ## インデックスが 2 の値を取得## 複数の値を取得subset = series[1:4] ## インデックスが 1 から 3 の値を取得## カスタムインデックスを使用value = series_with_index['b'] ## インデックスが 'b' の値を取得## インデックスと値の対応関係for index, value in series_with_index.items():print(f"Index: {index}, Value: {value}") -
基本運算
## 算術運算result = series * 2 ## 全要素を 2 倍## フィルタリングfiltered_series = series[series > 2] ## 2 より大きい要素を選択## 数学関数import numpy as npresult = np.sqrt(series) ## 各要素の平方根を取る -
属性とメソッド
## インデックスの取得index = series_with_index.index## 値配列の取得values = series_with_index.values## 記述統計情報の取得stats = series_with_index.describe()## 最大値・最小値のインデックス取得max_index = series_with_index.idxmax()min_index = series_with_index.idxmin() -
注意事項
- Series のデータは有序です。
- Series はインデックス付きの1次元配列と見なすことができます。
- インデックスは一意である必要はありません。
- データはスカラー、リスト、NumPy配列などで構いません。
pandas dataframe
dataframe構造
- 列と行: DataFrame は複数の列で構成され、それぞれの列には名前があり、1つの Series として見ることができます。同時に、DataFrame には行インデックスがあり、各行を識別します。
- 二次元構造: DataFrame は行と列を持つ二次元の表で、複数の Series オブジェクトからなる辞書のように見ることもできます。
- 列のデータ型: 異なる列は異なるデータ型を含むことができます。例えば整数、浮動小数、文字列など。
pandas.DataFrame( data, index, columns, dtype, copy)
# data:一組のデータ(ndarray、series、map、lists、dict 型)。# index:インデックス値、行ラベルとも呼ばれます# columns:列ラベル、デフォルトは RangeIndex (0, 1, 2, …, n)# dtype:データ型、デフォルトは自動判定。# copy:データをコピー、デフォルトは False。dataframeの実例
-
DataFrame の使用
import pandas as pddata = [['Google',10],['Runoob',12],['Wiki',13]]df = pd.DataFrame(data,columns=['Site','Age'])print(df) -
ndarrays で作成
import pandas as pddata = {'Site':['Google', 'Runoob', 'Wiki'], 'Age':[10, 12, 13]}df = pd.DataFrame(data)print (df) -
辞書リストから作成
import pandas as pddata = [{'a': 1, 'b': 2},{'a': 5, 'b': 10, 'c': 20}]df = pd.DataFrame(data)print (df)対応するデータがない部分は NaN。
-
loc を使って指定行を返す Pandas は loc 属性を用いて指定した行のデータを返します。インデックスが設定されていない場合、最初の行のインデックスは 0、次の行は 1、以下同様です。
import pandas as pddata = {"calories": [420, 380, 390],"duration": [50, 40, 45]}# DataFrame へデータを読み込むdf = pd.DataFrame(data)# 第1行を返すprint(df.loc[0])# 第2行を返すprint(df.loc[1])# 第1行と第2行を返すprint(df.loc[[0, 1]])# 指定インデックスprint(df.loc["duration"]) -
pd.DataFrame でインデックスを指定
import pandas as pddata = {"calories": [420, 380, 390],"duration": [50, 40, 45]}df = pd.DataFrame(data, index = ["day1", "day2", "day3"])print(df)
dataframeの基本操作
-
基本操作
# 列の取得name_column = df['Name']# 行の取得first_row = df.loc[0]# 複数列の選択subset = df[['Name', 'Age']]# 行のフィルタfiltered_rows = df[df['Age'] > 30] -
データ操作
# 新しい列の追加df['Salary'] = [50000, 60000, 70000]# 列の削除df.drop('City', axis=1, inplace=True)# ソートdf.sort_values(by='Age', ascending=False, inplace=True)# 列名の変更df.rename(columns={'Name': 'Full Name'}, inplace=True) -
属性とメソッド
# 列名の取得columns = df.columns# 形状の取得(行数と列数)shape = df.shape# インデックスの取得index = df.index# 記述統計情報の取得stats = df.describe() -
外部データ源からの作成
# CSV ファイルから DataFrame を作成df_csv = pd.read_csv('example.csv')# Excel ファイルから DataFrame を作成df_excel = pd.read_excel('example.xlsx')# 辞書リストから DataFrame を作成data_list = [{'Name': 'Alice', 'Age': 25}, {'Name': 'Bob', 'Age': 30}]df_from_list = pd.DataFrame(data_list) -
注意事項
- DataFrame は柔軟なデータ構造で、異なるデータ型の列を格納できます。
- 列名と行インデックスは文字列、整数などを含むことがあります。
- DataFrame はデータの選択、フィルタ、修正、分析を多様な方法で行えます。
- DataFrame の操作を通じて、データのクリーニング、変換、分析、可視化などを行うことができます。
pandas CSV
紹介
CSV(Comma-Separated Values、カンマ区切り値、時には文字区切り値とも呼ばれる。区切り文字が必ずしもカンマとは限らない)、ファイルはプレーンテキスト形式で表形式データ(数字とテキスト)を保存します。
CSV は一般的で比較的シンプルなファイル形式で、ユーザー・ビジネス・科学の分野で広く利用されています。
-
CSV の処理 Pandas は CSV ファイルの処理を非常に容易に行えます
import pandas as pddf = pd.read_csv('site.csv')print(df.to_string()) -
CSV の保存 DataFrame を CSV ファイルとして保存するには to_csv() を使用します
import pandas as pd# 三つのフィールド name, site, agenme = ["Google", "Runoob", "Taobao", "Wiki"]st = ["www.google.com", "www.runoob.com", "www.taobao.com", "www.wikipedia.org"]ag = [90, 40, 80, 98]# 辞書dict = {'name': nme, 'site': st, 'age': ag}df = pd.DataFrame(dict)# DataFrame の保存df.to_csv('site.csv')
データ処理
head()
head(n) メソッドは先頭の n 行を読み取ります。引数 n を指定しない場合はデフォルトで 5 行を返します。
import pandas as pd
df = pd.read_csv('nba.csv')print(df.head())
print(df.head(10))tail()
tail(n) メソッドは末尾の n 行を読み取ります。引数を指定しない場合はデフォルトで 5 行を返します。空行の各フィールドの値は NaN となります。
import pandas as pd
df = pd.read_csv('nba.csv')print(df.tail())
print(df.tail(10))info()
info() メソッドは表の基本情報を返します:
import pandas as pd
df = pd.read_csv('nba.csv')print(df.info())Pandas JSON
JSON(JavaScript Object Notation、JavaScript のオブジェクト表記法)は、テキスト情報を保存・交換するための文法で、XMLに似ています。
JSON は XML より小さく、高速で、解析が容易です。JSON に関する詳細は JSON チュートリアルを参照してください。
Pandas は JSON データの処理を非常に簡単に行えます。
普通JSON処理
import pandas as pd
df = pd.read_json('sites.json')print(df.to_string())
URL = '<https://static.runoob.com/download/sites.json>'df = pd.read_json(URL)print(df)JSON オブジェクトは Python の辞書と同じフォーマットを持つため、Python の辞書をそのまま DataFrame データに変換できます。
内嵌JSON処理
ネストされたデータを完全に解析するには json_normalize() メソッドを使用します。
import pandas as pdimport json
# Python の JSON モジュールを使用してデータを読み込むwith open('nested_list.json','r') as f: data = json.loads(f.read())
# データをフラット化df_nested_list = pd.json_normalize(data, record_path =['students'])print(df_nested_list)より複雑なデータ
import pandas as pdimport json
# Python の JSON モジュールを使用してデータを読み込むwith open('nested_mix.json','r') as f: data = json.loads(f.read())
df = pd.json_normalize( data, record_path =['students'], meta=[ 'class', ['info', 'president'], ['info', 'contacts', 'tel'] ])
print(df)ネストされたJSONの一部データを読む
glom モジュールを使用してデータのネストを扱います。glom モジュールを使って、’.’ を使ってネストされたオブジェクトの属性にアクセスします。
-
glom のインストール
pip3 install glom -
使用方法
import pandas as pdfrom glom import glomdf = pd.read_json('nested_deep.json')data = df['students'].apply(lambda row: glom(row, 'grade.math'))print(data)
データのクリーニング
欠損値のクリーニング
欠損値を含む行を削除したい場合、dropna() メソッドを使用します。書式は以下のとおりです:
DataFrame.dropna(axis=0, how='any', thresh=None, subset=None, inplace=False)
# axis:デフォルトは 0。NA を含む行を削除。axis=1 を設定するとNAを含む列を削除します。# how:デフォルトは 'any'。行(または列)に NA が1つでも含まれていればその行を削除。how='all' の場合、行(または列)がすべて NA のときのみ削除します。# thresh:残すべき非空値の最小数を設定します。# subset:チェックしたい列を設定します。複数列の場合、列名のリストを引数として使用します。# inplace:True に設定すると、計算結果を元のデータに直接上書きして、None を返します。元データを変更します。isnull() を使って、各セルが空かどうかを判定できます。
pandas.read_csv で na_values を指定して、空値を指定することができます
import pandas as pd
df = pd.read_csv('property-data.csv')
print(df['NUM_BEDROOMS'])print(df['NUM_BEDROOMS'].isnull())
# 空データを指定missing_values = ["n/a", "na", "--"]df = pd.read_csv('property-data.csv', na_values = missing_values)
print (df['NUM_BEDROOMS'])print (df['NUM_BEDROOMS'].isnull())
# 空データを削除new_df = df.dropna()print(new_df.to_string())
# 元の DataFrame を上書きdf.dropna(inplace = True)print(df.to_string())
# 特定の空値を含む行を削除df.dropna(subset=['ST_NUM'], inplace = True)print(df.to_string())fillna() を使って空値を置換します
空セルを置換する一般的な方法は、列の平均値・中央値・最頻値を計算することです。
Pandas は mean()、median()、mode() メソッドを使用して、列の平均値(全値の総和を割った値)、中央値、および最頻値(出現頻度が最も高い値)を計算します。
import pandas as pd
df = pd.read_csv('property-data.csv')
# 空のフィールドを 12345 で置換df.fillna(12345, inplace = True)print(df.to_string())
# 平均値で空値を置換x = df["ST_NUM"].mean()df["ST_NUM"].fillna(x, inplace = True)print(df.to_string())
# 中央値で空値を置換x = df["ST_NUM"].median()df["ST_NUM"].fillna(x, inplace = True)print(df.to_string())
# 最頻値で空値を置換x = df["ST_NUM"].mode()df["ST_NUM"].fillna(x, inplace = True)print(df.to_string())フォーマットエラーのクリーニング
データ形式が正しくないセルは、データ分析を難しくし、場合によっては不可能にします。
ネストされたセルを含む行、または列内のすべてのセルを同じ形式のデータに変換することで対応できます。
import pandas as pd
# 3番目の日付形式が間違っていますdata = { "Date": ['2020/12/01', '2020/12/02' , '20201226'], "duration": [50, 40, 45]}df = pd.DataFrame(data, index = ["day1", "day2", "day3"])
# 新しい Python 3 では、下の行はエラーになり、format='mixed' を明示して混合形式を許可する必要があります# pd.to_datetime(df['Date'])df['Date'] = pd.to_datetime(df['Date'], format='mixed')print(df.to_string())astype でデータ形式を変更する
data['語文'].dropna(how='any').astype('int')エラーデータのクリーニング
import pandas as pd
person = { "name": ['Google', 'Runoob' , 'Taobao'], "age": [50, 200, 12345]}
df = pd.DataFrame(person)
# データを直接変更df.loc[2, 'age'] = 30
# ループで判定for x in df.index: if df.loc[x, "age"] > 120: df.loc[x, "age"] = 120
# 行を削除for x in df.index: if df.loc[x, "age"] > 120: df.drop(x, inplace = True)
print(df.to_string())重複データのクリーニング
もし重複データをクリーニングする場合、duplicated() と drop_duplicates() メソッドを使います。
対応するデータが重複している場合、duplicated() は True を返し、そうでなければ False を返します。
import pandas as pd
person = { "name": ['Google', 'Runoob', 'Runoob', 'Taobao'], "age": [50, 40, 40, 23]}df = pd.DataFrame(person)
# 重複データの検索print(df.duplicated())
# 重複データの削除df.drop_duplicates(inplace = True)print(df)部分信息可能已经过时