


1.实验目的
- 掌握运输层UDP协议内容
- 理解UDP协议的工作原理
- 了解应用层和运输层协议的关系
2.实验环境
- 硬件要求:阿里云云主机ECS 一台。
- 软件要求:Linux/ Windows 操作系统
3.实验内容
UDP(User Datagram Protocol)用户数据报协议是一种无连接的运输层协议,提供面向事物的简单不可靠信息传送服务,服务于很多应用层协议包括网络文件系统(NFS),简单的网络管理协议(SNMP),域名系统(DNS)以及简单的文件传输系统(TFTP)。与TCP不同UDP并不提供对IP协议的可靠机制,控制以及错误恢复等。由于UDP比较简单,UDP头包含很少的字节,比TCP负载消耗少。
完成下面实验并填写表格,回答问题。
3.1 DNS查询UDP数据分析
使用tcpdump抓取DNS查询网络通信数据包,利用wireshark分析UDP数据。
例如:
dig www.xju.edu.cn3.2 QQ通信UDP数据分析
利用wireshark抓取QQ网络通信数据包,分析UDP数据。
QQ客户端之间消息传送采用了UDP。国内网络环境非常复杂而且很多用户采用的方式是通过代理服务器共享一条线路上网方式,UDP包能够穿透大部分的代理服务器,因此QQ选择了UDP作为客户之间的通信协议。因此我们打开QQ聊天窗口开启捕获,与好友进行对话,停止捕获就得到了UDP数据包。
4.实验结果与分析
4.1 根据捕获的数据包,分析UDP的报文结构,将UDP协议中个字段名,字段值,字段信息填入下表:
- DNS查询UDP数据分析
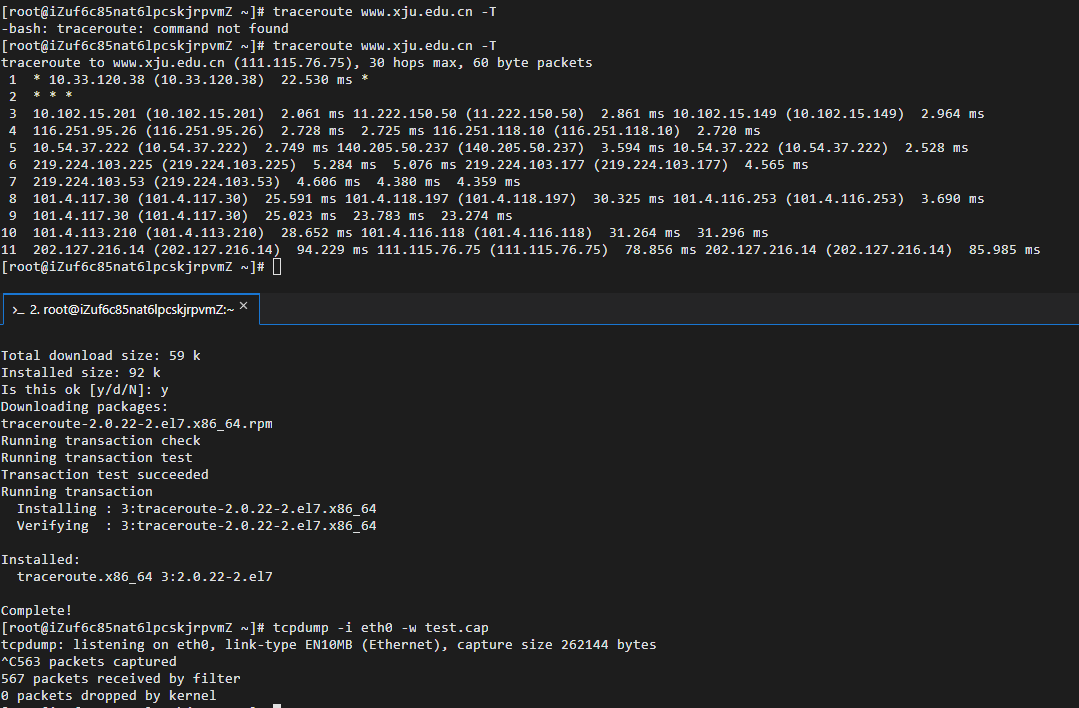
先通过tcpdump -i eth0 -w test.cap和traceroute www.xju.edu.cn -T进行抓包,然后对于test.cap中的数据进行分析,运行过程如下图:
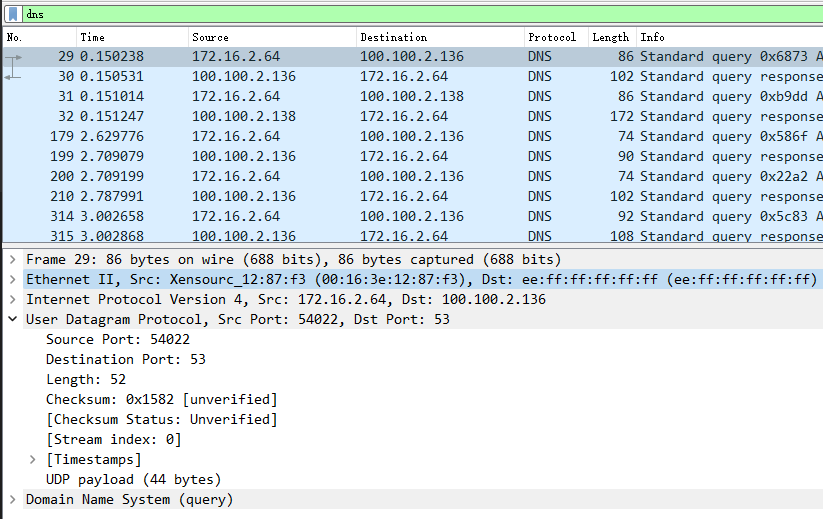
然后对dns进行过滤并分析UDP数据,如下图
将获取数据填入下表
| 字段名 | 字段值 | 字段信息 |
|---|---|---|
| Source Port | 54022 | Source Port: 54022 |
| Destination Port | 53 | Destination Port: 53 |
| Length | 52 | Length: 52 |
| Checksum | 0x1582 | Checksum: 0x1582 [unverified] |
- QQ通信UDP数据分析
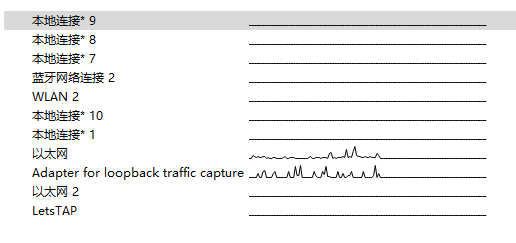
通过wireshark抓取本地qq数据,过程如下图:
- 选择以太网
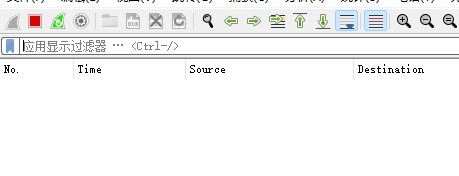
- 结束抓包
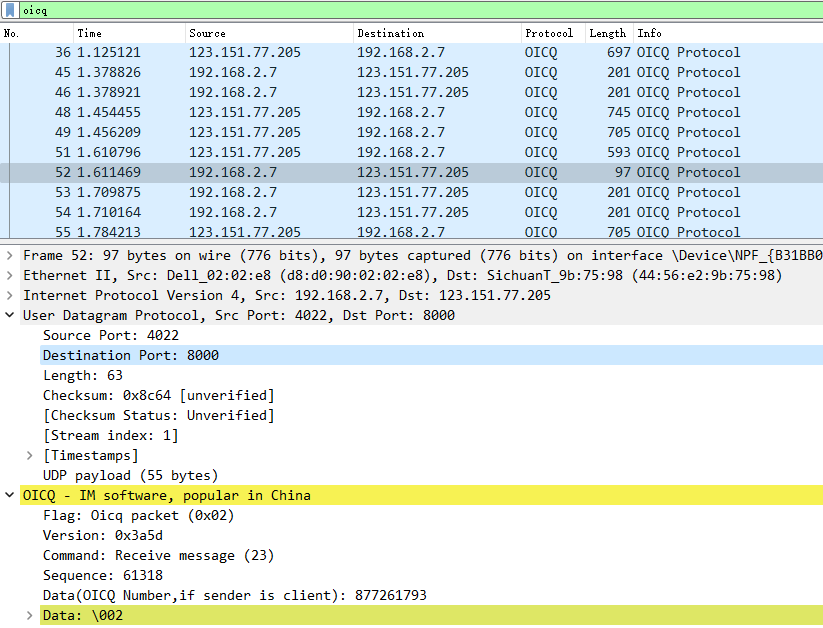
- 过滤OICQ并分析获取数据
将获取数据填入下表
| 字段名 | 字段值 | 字段信息 |
|---|---|---|
| Source Port | 4022 | Source Port: 4022 |
| Destination Port | 8000 | Destination Port: 8000 |
| Length | 63 | Length: 63 |
| Checksum | 0x8c64 | Checksum: 0x8c64 [unverified] |
4.2 通过分析实验结果,UDP报文结构由哪几部分组成,其功能是什么?
通过实验获得数据,我们可以发现,UDP报文主体分为两个部分
UDP首部中的四个字段每一个占用两个字节(16 bit),其功能为:
源端口号
传递源端口号有助于服务器端应用程序确定报文的来源。目的端口号
传递目的端口号可以使目的主机将应用数据交付运行在目的端口的响应进程(即执行分解功能)。长度
长度字段则指示了在UDP报文段中的字节数(首部加数据),因为数据字段的长度在UDP报文段中不是固定的,为了便于接收端程序的处理,所以需要一个长度字段。检验和
接收方使用检验和来检查该报文段中是否出现了差错。
5、实验小结
5.1 问题与解决办法
问题在使用traceroute命令时,出现-bash: traceroute: command not found错误解决方法使用yum install traceroute命令,首先安装traceroute 问题使用Xftp连接服务器时,出现连接错误的情况解决方法使用校园网连接后恢复正常,排查后发现为服务器防火墙原因
5.2 心得体会
- 本次实验报告熟系了对IP协议分析过程中代码及软件的操作,以及对UDP报文的分析与提取,实现对课上知识的印证。通过这次实验,我掌握了traceroute命令使用中的具体流程,了解了常用IP协议分析软件的基本用法,提高了自身编程能力。
- 通过这些常用的IP协议分析命令操作,对IP协议使用时的跟踪分析,UDP报文的结构分析,让我印证了上课所学的知识。
1. Experiment Objectives
- Master the UDP protocol contents in the transport layer
- Understand the working principle of the UDP protocol
- Understand the relationship between application-layer and transport-layer protocols
2. Experimental Environment
- Hardware requirements: One Alibaba Cloud ECS instance.
- Software requirements: Linux/Windows operating systems
3. Experimental Content
UDP (User Datagram Protocol) is a connectionless transport-layer protocol that provides a simple, unreliable datagram delivery service for individual messages, serving many application-layer protocols including the Network File System (NFS), Simple Network Management Protocol (SNMP), the Domain Name System (DNS), and Trivial File Transfer Protocol (TFTP). Unlike TCP, UDP does not provide reliability mechanisms, control, or error recovery for IP. Because UDP is simpler, the UDP header contains fewer bytes and consumes less overhead than TCP.
Complete the following experiments and fill in the tables, answering the questions.
3.1 DNS UDP Data Analysis
Use tcpdump to capture DNS query network packets, and analyze UDP data with Wireshark.
For example:
dig www.xju.edu.cn3.2 QQ UDP Data Analysis
Use Wireshark to capture QQ network communication packets, and analyze UDP data.
Messages between QQ clients are transmitted using UDP. The domestic network environment is very complex, and many users access the Internet via proxy servers sharing a single line; UDP packets can penetrate most proxy servers, so QQ chose UDP as the communication protocol between clients. Therefore, we open the QQ chat window to start capture, chat with a friend, and stopping the capture yields UDP packets.
4. Results and Analysis
4.1 Based on captured packets, analyze the UDP datagram structure and fill in the field names, field values, and field information in the table below:
- DNS UDP Data Analysis
First, capture with tcpdump -i eth0 -w test.cap and traceroute www.xju.edu.cn -T, then analyze the data in test.cap. The procedure is shown in the figure below:
Then filter DNS and analyze UDP data, as shown in the figure below
Enter the obtained data into the table below
| Field Name | Field Value | Field Information |
|---|---|---|
| Source Port | 54022 | Source Port: 54022 |
| Destination Port | 53 | Destination Port: 53 |
| Length | 52 | Length: 52 |
| Checksum | 0x1582 | Checksum: 0x1582 [unverified] |
- QQ UDP Data Analysis
Capture local QQ data with Wireshark, process shown below:
- Select Ethernet
- Stop capture
- Filter OICQ and analyze the obtained data
Enter the obtained data into the table below
| Field Name | Field Value | Field Information |
|---|---|---|
| Source Port | 4022 | Source Port: 4022 |
| Destination Port | 8000 | Destination Port: 8000 |
| Length | 63 | Length: 63 |
| Checksum | 0x8c64 | Checksum: 0x8c64 [unverified] |
4.2 From the analysis results, what parts make up the UDP datagram and what are their functions?
From the data obtained in the experiment, we can see that the UDP datagram consists of two parts: UDP header (8 bytes) + UDP data/payload, where the UDP header is composed of source port, destination port, length, and checksum.
The four fields in the UDP header each occupy two bytes (16 bits), and their functions are:
Source Port
The source port helps the server-side application determine the origin of the datagram.
Destination Port
The destination port allows the destination host to deliver the application data to the process listening on the destination port (i.e., the responding process).
Length
The Length field indicates the number of bytes in the UDP datagram (header plus data). Because the length of the data field in a UDP datagram is not fixed, a length field is needed to facilitate processing by the receiving end.
Checksum
The receiver uses the checksum to verify whether errors occurred in this datagram.
5. Summary of the Experiment
5.1 Issues and Solutions
When using traceroute, the error -bash: traceroute: command not found occurred. Solution: install traceroute using the command yum install traceroute, which installs traceroute. When connecting to the server with Xftp, connection errors occurred. Solution: after switching to the campus network, the connection returned to normal; investigation showed the issue was caused by the server firewall.
5.2 Reflections
- This experiment familiarized the operation of code and software in IP protocol analysis, as well as the analysis and extraction of UDP datagrams, validating the knowledge learned in class. Through this experiment, I mastered the concrete workflow of using the traceroute command, understood the basic usage of commonly used IP protocol analysis software, and improved my programming ability.
- Through these common IP protocol analysis commands and the tracing/analysis of IP protocol usage, and UDP datagram structure analysis, I corroborated what was taught in class.
1.実験目的
- トランスポート層UDPプロトコルの内容を把握する
- UDPプロトコルの動作原理を理解する
- アプリケーション層とトランスポート層プロトコルの関係を理解する
2.実験環境
- ハードウェア要件:阿里雲クラウドホスト ECS を1台。
- ソフトウェア要件:Linux/Windows オペレーティングシステム
3.実験内容
UDP(User Datagram Protocol、ユーザデータグラムプロトコル)は、コネクションレス型のトランスポート層プロトコルで、イベント指向の単純で信頼性のないデータ伝送サービスを提供します。多くのアプリケーション層プロトコル(NFS、SNMP、DNS、TFTP など)をサポートします。TCPとは異なり、UDPはIPプロトコルの信頼性機構、制御、エラー回復などを提供しません。UDPは比較的シンプルで、UDPヘッダには少ないバイトしか含まれず、TCPよりペイロードの消費が少ないです。
以下の実験を完了し、表を埋め、質問に答えてください。
3.1 DNSクエリ UDPデータ分析
tcpdumpを使用してDNSクエリのネットワーク通信パケットを取得し、wiresharkを用いてUDPデータを分析します。
例:
dig www.xju.edu.cn3.2 QQ UDPデータ分析
Wiresharkを使用してQQネットワーク通信データパケットを取得し、UDPデータを分析します。
QQクライアント間のメッセージ伝送はUDPを採用しています。国内のネットワーク環境は非常に複雑で、多くのユーザーが代理サーバを介して同じ回線でインターネットに接続する方法を採用しているため、UDPパケットは大半の代理サーバを透過できます。そのためQQはクライアント間の通信プロトコルとしてUDPを選択しました。したがって、QQのチャットウィンドウを開いてキャプチャを開始し、友人と会話をしてキャプチャを停止するとUDPデータパケットを得ることができます。
4.実験結果と分析
4.1 捕捉データに基づくUDPメッセージ構造の分析:UDPプロトコルの各フィールド名・値・情報を下表に入力
- DNSクエリ UDPデータ分析
まずtcpdump -i eth0 -w test.capとtraceroute www.xju.edu.cn -Tを用いて捕捉し、test.cap内のデータを分析します。実行過程は以下の図のとおりです。
次にDNSをフィルタしてUDPデータを分析します。下の図のとおりです。
取得データを下表に入力します。
| フィールド名 | フィールド値 | フィールド情報 |
|---|---|---|
| 送信元ポート | 54022 | 送信元ポート: 54022 |
| 宛先ポート | 53 | 宛先ポート: 53 |
| 長さ | 52 | 長さ: 52 |
| チェックサム | 0x1582 | チェックサム: 0x1582 [未検証] |
- QQ UDPデータ分析
Wiresharkを使用してローカルのQQデータをキャプチャした過程は以下の図です。
- イーサネットを選択
- キャプチャを終了
- OICQをフィルタしてデータを取得・分析
取得データを下表に入力します。
| フィールド名 | フィールド値 | フィールド情報 |
|---|---|---|
| 送信元ポート | 4022 | 送信元ポート: 4022 |
| 宛先ポート | 8000 | 宛先ポート: 8000 |
| 長さ | 63 | 長さ: 63 |
| チェックサム | 0x8c64 | チェックサム: 0x8c64 [未検証] |
4.2 実験結果の分析に基づくUDPパケット構造はどのような部分で構成され、それぞれの機能は何か?
実験で得られたデータから、UDPパケットの本体は2つの部分に分かれます:UDPヘッダ(8バイト)+ UDPデータ/UDPペイロード。UDPヘッダは送信元ポート、宛先ポート、長さ、チェックサムで構成されています。
UDPヘッダの4つのフィールドは、それぞれ2バイト(16ビット)を占め、その機能は以下のとおりです:
送信元ポート
送信元ポートは、サーバー側アプリケーションがパケットの送信元を特定するのに役立ちます。宛先ポート
宛先ポートは、宛先ホストがそのポートで待機しているアプリケーションデータを対応する応答プロセスへ渡すのに役立ちます(=対応機能を実行します)。長さ
長さフィールドは、UDPパケット全体のバイト数(ヘッダを含むデータ)を示します。データフィールドの長さはUDPペイロード内で固定されていないため、受信側プログラムの処理を容易にするために長さフィールドが必要です。検査和
チェックサム
受信側はチェックサムを用いて、このパケットに誤りが含まれていないかを検査します。
5.実験結論
5.1 問題と解決方法
-
tracerouteコマンド使用時に -bash: traceroute: command not found というエラーが発生しました。解決方法として、yum install traceroute コマンドを実行して traceroute をインストールします。
-
Xftpを使ってサーバーへ接続する際に接続エラーが発生した場合、キャンパスネットワークに接続してから通常に戻ることを確認しました。原因はサーバーファイアウォールによるものと判明しました。
5.2 感想
- 本実験レポートでは、IPプロトコル分析の過程でのコードとソフトウェアの操作に熟練し、UDPパケットの分析と抽出を通じて授業で学んだ知識を実証しました。今回の実験を通じて、tracerouteコマンドの具体的な使用手順を身につけ、一般的なIPプロトコル分析ソフトウェアの基本的な使い方を理解し、プログラミング能力を向上させました。
- これらの一般的なIPプロトコル分析コマンドの操作を通じて、IPプロトコルの追跡分析とUDPパケットの構造分析を実践し、授業で学んだ知識を再確認しました。
部分信息可能已经过时