



1. Experiment Objectives
- Understand the IP packet format, and become familiar with the meaning and length of each IP header field
- Master packet capture and analysis techniques based on tcpdump and Wireshark
2. Experimental Environment
- Hardware requirements: One Alibaba Cloud ECS instance.
- Software requirements: Linux/Windows operating system
3. Experimental Content
3.1 Basic tcpdump Usage
tcpdump is a tool used to capture network packets and output their contents. With its powerful features and flexible capture filters, it has become the preferred tool on UNIX-like systems for network analysis and problem troubleshooting.
tcpdump supports filtering by network layer, protocol, host, network, or port, and provides logical statements such as and, or, not to help you weed out unnecessary information.
References:
https://www.cnblogs.com/ggjucheng/archive/2012/01/14/2322659.html
3.2 Basic Wireshark Usage
Wireshark (formerly Ethereal) is a network packet analysis software. The function of network packet analysis software is to capture network packets and display as detailed packet information as possible. Wireshark uses WinPcap as the interface, exchanging data frames directly with the network card.
Network administrators use Wireshark to detect network problems; network security engineers use Wireshark to inspect information security related issues; developers use Wireshark to debug new communication protocols; ordinary users use Wireshark to learn about network protocols. Its interface is shown in the figure below.
References:
https://www.wireshark.org/#download
https://pc.qq.com/search.html#!keyword=wireshark
3.3 Capture Packets with tcpdump and Analyze with Wireshark
On the Alibaba Cloud host, run the command traceroute www.xju.edu.cn –T, and capture packets using tcpdump. Download the file to your local machine and analyze it with Wireshark.
Tips:
- You must run the capture command first, then run the traceroute command. Capture command:
tcpdump -i eth0 -w test.cap - You can download the data using the
scpcommand or by usingxshellandxftp.
- Capture with
tcpdump, analyze the captured data withwireshark, analyze the IP packet structure, and fill the IP protocol tree’s field names, field lengths, and field information into the table below.
| Field Name | Field Length | Field Value | Field Description |
|---|---|---|---|
| Version | 4bit | 4 | Indicates the IP protocol version |
| Header length IP | 4bit | 20 | Indicates the IP header length |
| Differentiated services Field | 8bit | 0x00 | Used to obtain better service. In old standards this field was called Type of Service and used to indicate packet priority, but it has not been used in practice. |
| Total length | 16bit | 40 | Indicates the total length of this IP packet |
| Indentification | 16bit | 0x6f33 | An ID number for the packet used to identify the data packet |
| flag | 3bit | 0x40 | Flags indicating whether there are more fragments |
| Fragment offset | 13bit | 0 | Offset of the fragment relative to the start of the original packet |
| Time to time | 8bit | 64 | Sets the maximum number of routers a datagram can traverse, also known as “hops.” |
| protocol | 8bit | 6 | Identifies which encapsulation protocol is used above the network layer |
| Header checksum | 16bit | 0x9d2c | Used to check the correctness of the header to prevent IP header data corruption |
| source | 32bit | 172.16.2.237 | Source IP address |
| destination | 32bit | 100.100.27.15 | Destination IP address |
- Use Wireshark to analyze and interpret the relevant traceroute command results.
Tip: Set the Wireshark filter bar to display only ICMP
4. Experimental Results and Analysis
4.1 Basic tcpdump Usage
tcpdump is a tool used to capture network packets and output their contents. With its powerful features and flexible capture filters, it has become the preferred tool on UNIX-like systems for network analysis and problem troubleshooting.
tcpdump supports filtering by network layer, protocol, host, network or port, and provides logical statements such as and, or, not to help you weed out useless information
- Default startup
tcpdump//普通情况下,直接启动tcpdump将监视第一个网络接口上所有流过的数据包。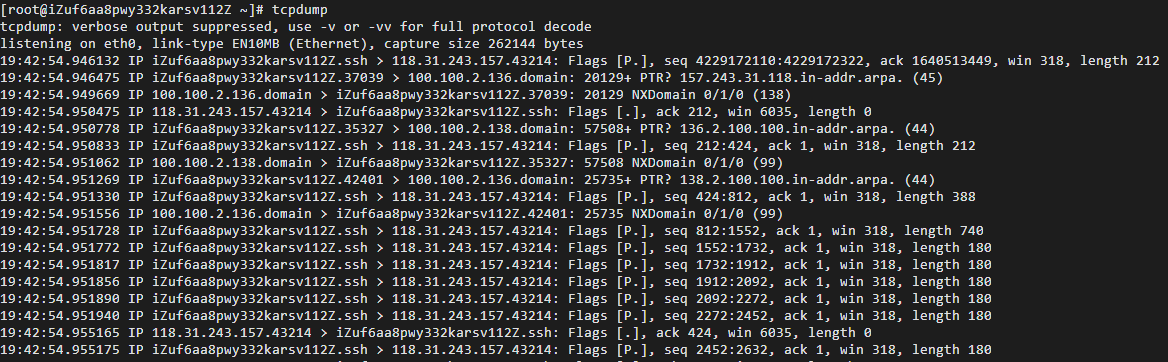
- Capture packets on a specified network interface
tcpdump -i eth1//如果不指定网卡,默认tcpdump只会监视第一个网络接口,一般是eth04.2 Basic Wireshark Usage
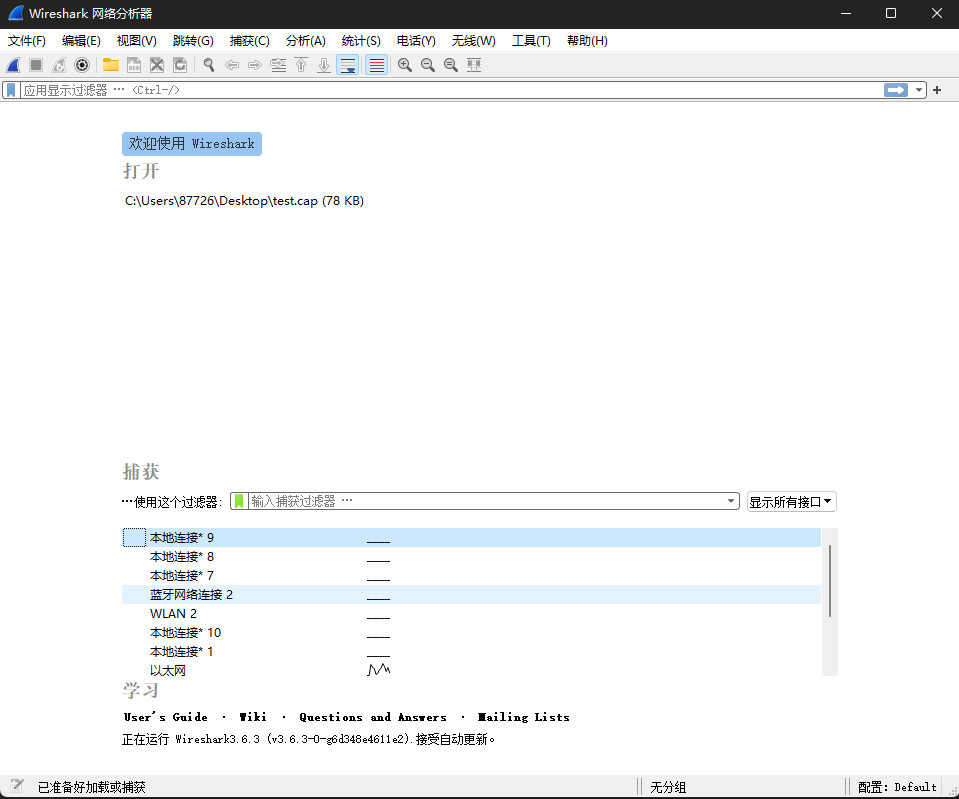
Wireshark (formerly Ethereal) is a network packet analysis tool. Its purpose is to capture network packets and display packet details as comprehensively as possible. Wireshark uses WinPcap as an interface to exchange data frames directly with the network card.
Network administrators use Wireshark to diagnose network issues, network security engineers use it to inspect information security problems, developers use it to debug new communication protocols, and ordinary users use it to learn about network protocols. Its interface is shown below.
4.3 Capture Packets with tcpdump and Analyze with Wireshark
- Execute the capture command
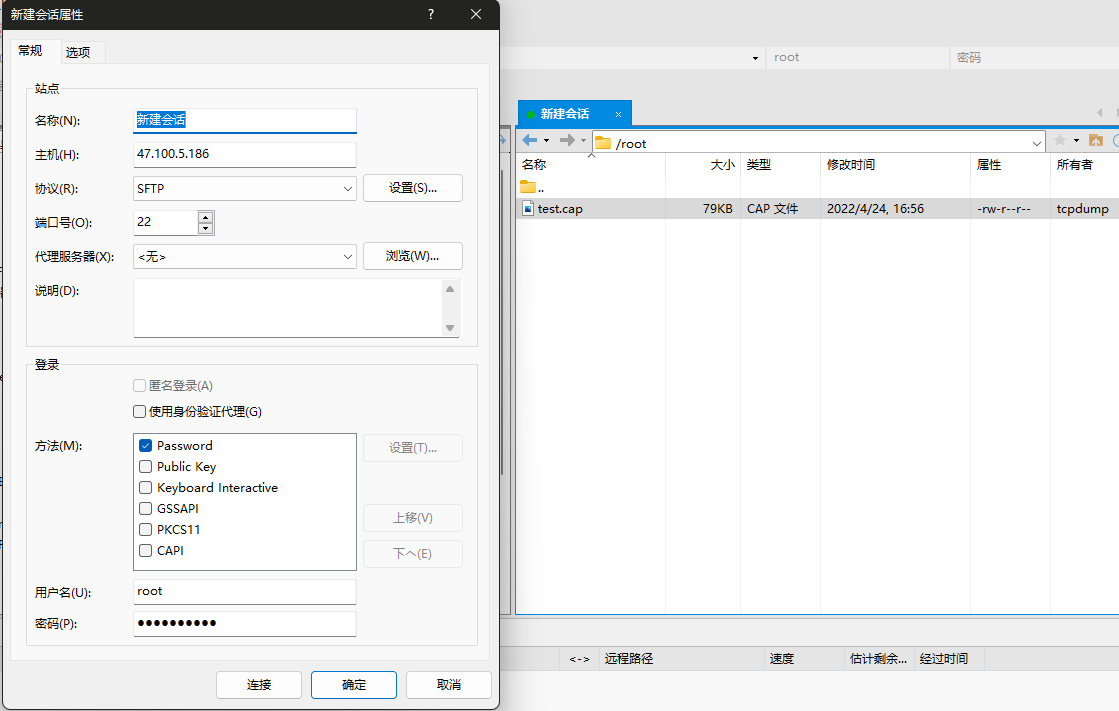
tcpdump -i eth0 -w test.capand store the captured information in the file/root/test.cap

- Run the command
traceroute www.xju.edu.cn –T

- Use
xftpto connect to the host, and save the captured packet file to your computer
- Use
wiresharkto open thetest.capfile, and analyze
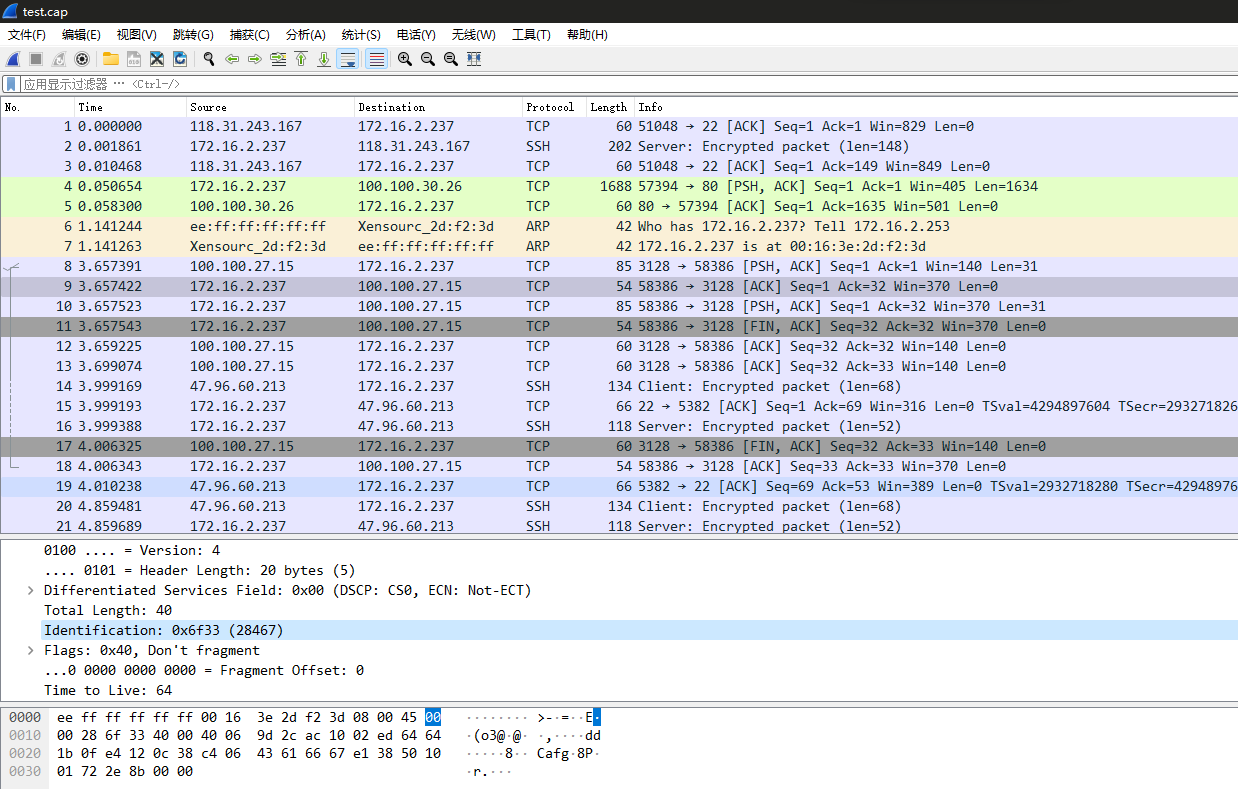
- For the captured packets, analyze the IP header structure and fill the IP protocol tree with the field names, lengths, and information into the table below.
| Field Name | Field Length | Field Value | Field Description |
|---|---|---|---|
| Version | 4bit | 4 | 0100 … = Version: 4 |
| Header length IP | 4bit | 20 | … 0101 = Header Length: 20 bytes (5) |
| Differentiated services Filed | 8bit | 0x00 | Differentiated Services Field: 0x00 (DSCP: CS0, ECN: Not-ECT) |
| Total length | 16bit | 40 | Total Length: 40 |
| Indentification | 16bit | 0x6f33 | Identification: 0x6f33 (28467) |
| flag | 3bit | 0x40 | Flags: 0x40, Don’t fragment |
| Fragment offset | 13bit | 0 | …0 0000 0000 0000 = Fragment Offset: 0 |
| Time to time | 8bit | 64 | Time to Live: 64 |
| protocol | 8bit | 6 | Protocol: TCP (6) |
| Header checksum | 16bit | 0x9d2c | Header Checksum: 0x9d2c [validation disabled] |
| source | 32bit | 172.16.2.237 | Source Address: 172.16.2.237 |
| destination | 32bit | 100.100.27.15 | Destination Address: 100.100.27.15 |
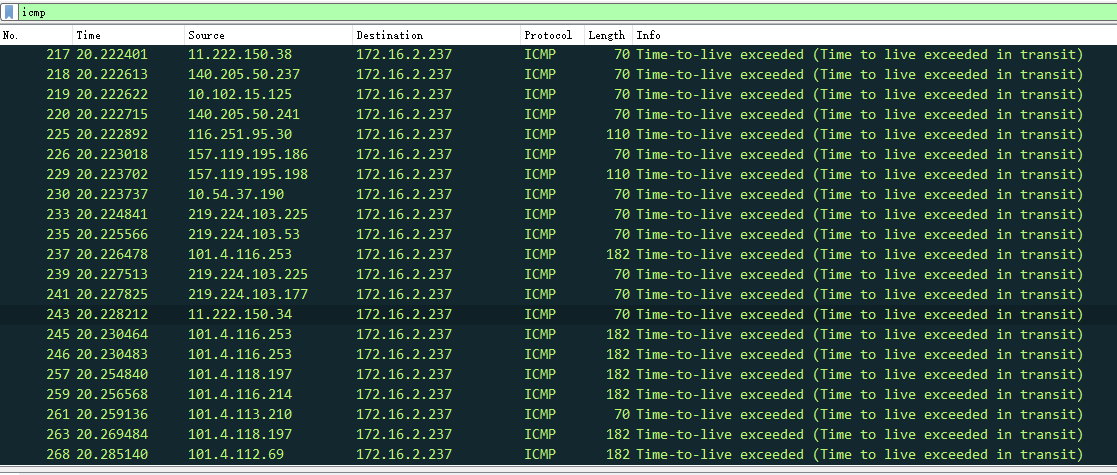
- Analyze and interpret the results of the related traceroute command execution, using ICMP to analyze the results.
Analysis results:
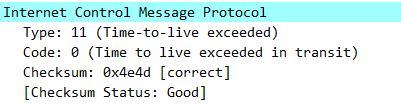
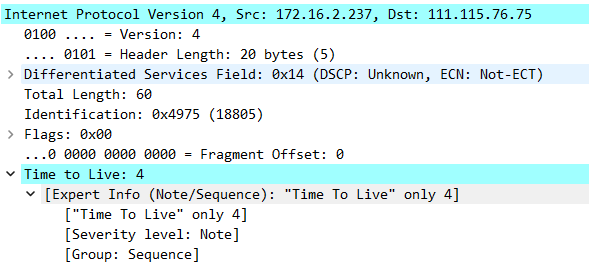
ICMP message types fall into two categories: ICMP error messages and ICMP echo messages. It can be seen that the ICMP messages we captured are all of type Time Exceeded in Transit, i.e., TTL exceeded. Choosing a random ICMP message, we can see that this ICMP message has Type=11, Code=0, which is an error-message type indicating time exceeded. Its checksum is 0x4e4d, which is correct, and the checksum status is good, with TTL equal to 4.
5. Experiment Summary
5.1 Problems and Solutions
The problem when using the traceroute command produced the error -bash: traceroute: command not found. Solution: use yum install traceroute to install traceroute.
When connecting to the server with Xftp, connection errors occurred. Solution: reconnect via campus network; after investigation found the cause was the server firewall.
5.2 Reflections
- This experiment familiarized me with the operation of code and software involved in IP protocol analysis, validating the knowledge learned in class. Through this experiment, I learned the concrete workflow for using the traceroute command, understood the basic usage of commonly used IP protocol analysis software, and improved my programming abilities.
- Through these common IP protocol analysis command operations, tracing IP protocol usage, this reinforced the knowledge taught in class.
If this article helped you, please share it with others!
Some information may be outdated